Home Value Forecast
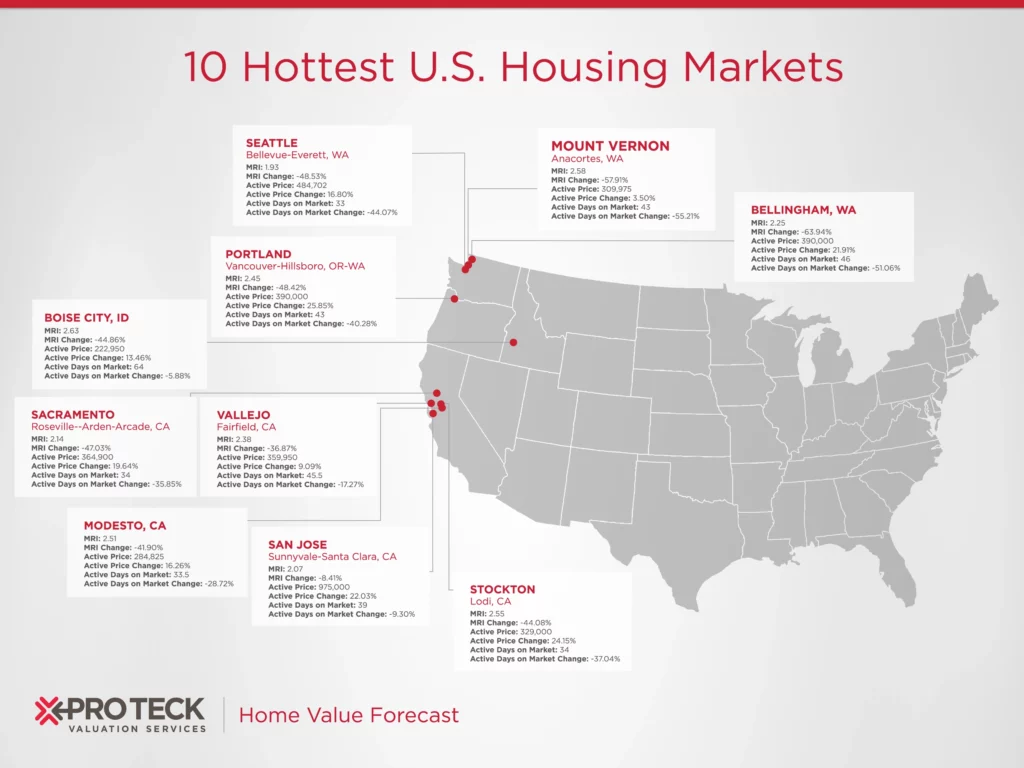
Home Value Forecast: Months of Remaining Inventory – National and Local Trends
Months of Remaining Inventory (MRI) is a data point often analyzed by Home Value Forecast. MRI is defined as the current number of active listings divided by the monthly sales rate. It combines both supply and demand into one number, giving a more holistic view of the state of the market. Traditionally, a balanced market would have an MRI of around 6 months.
In this month’s update, we examined 200 metro areas Home Value Forecast tracks on a monthly basis and found that the weighted average MRI as of June is 6.11 months. Twelve months prior, this weighted national average was 6.97, thus the MRI has dropped over 12 percent.
Home Value Forecast believes all real estate is local and that national numbers mean little when you are buying or selling in a particular market. Although the national trend seems promising, it’s important to evaluate fundamentals at the metro level.
2014 vs. 2015 MRI Outliers
MRI is a reflection of supply and demand in a local real estate market – with a low MRI signifying a “seller’s market” and high MRI a “buyer’s market.” We examined the metros areas with less than 4 MRI, which are considered “hot” markets and those with over 10 MRI, considered “cold” in the following table.
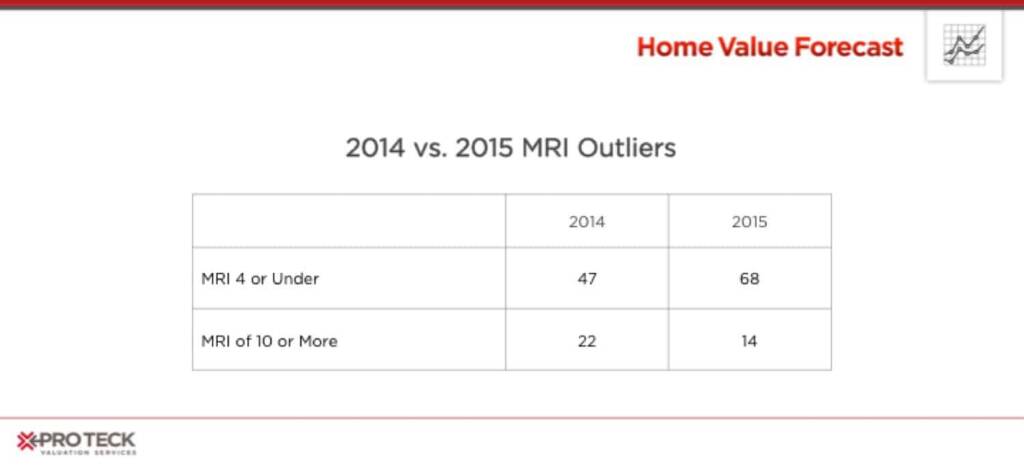
There is good movement here as the number of “hots” have increased 45% and the number of 10+ MRI areas have a -36% decrease. We further explored the top and bottom 10 MRI CBSAs for this month:
Top Ten (Lowest MRIs):
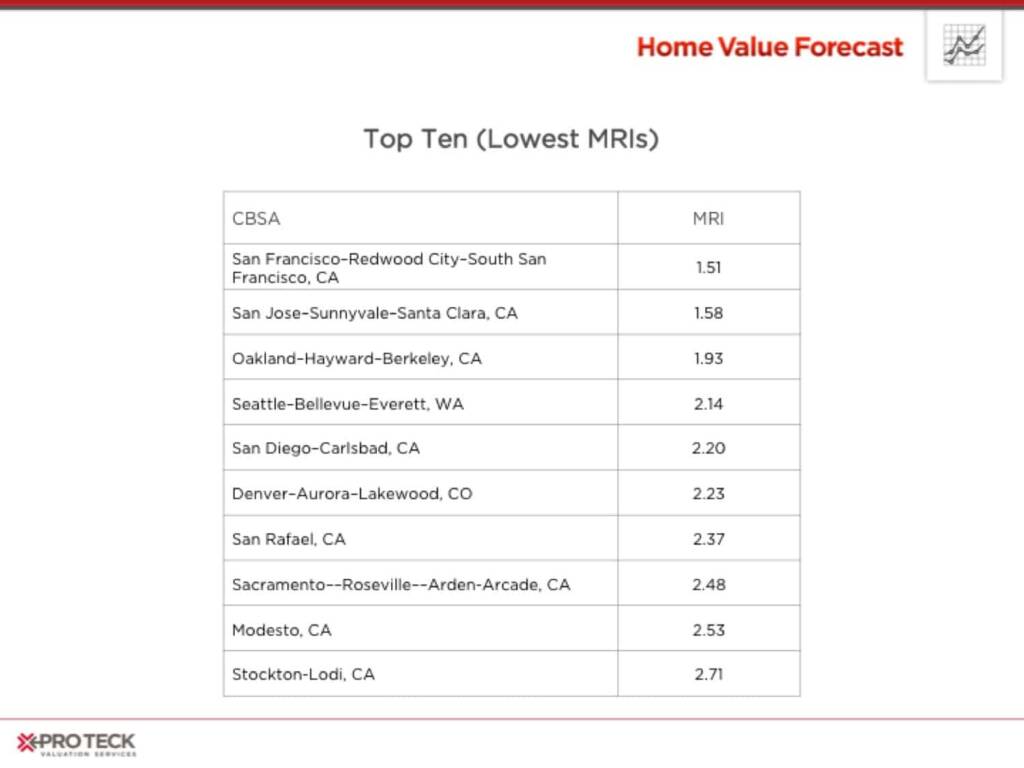
Eight of the top ten lowest MRIs are in California, with Seattle and Denver being the only two from out of state. The West Coast regions continue to be “hot” as reflected in our monthly Top Ten over the past year.
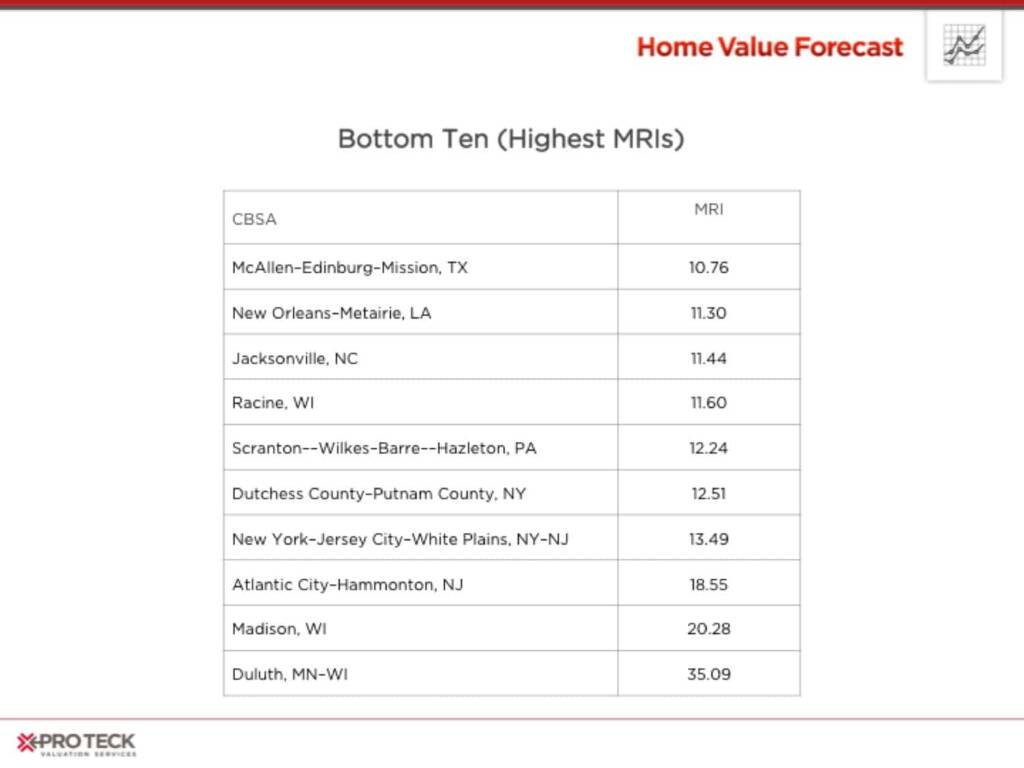
We also show the metros with the highest MRI. As seen below, the East Coast and rural CBSAs have the highest MRI numbers right now, with three Wisconsin and three New York/New Jersey CBSAs making up the majority.
Bottom Ten (Highest MRIs):
MRI Percent Change 2014 to 2015
To provide some more context around MRI as an indicator, we examined one-year MRI change leaders and then added Collateral Analytics Market Condition Rating into the results below. The rating system has seven descriptive “buckets” it places metros in based on a proprietary methodology that analyzes the nine market indicators outlined in HVF’s Top and Bottom Ten. These descriptive buckets include: Hot, Strong, Good, Normal, Soft, Weak and Distressed.
Top Percent Decreases in MRI:
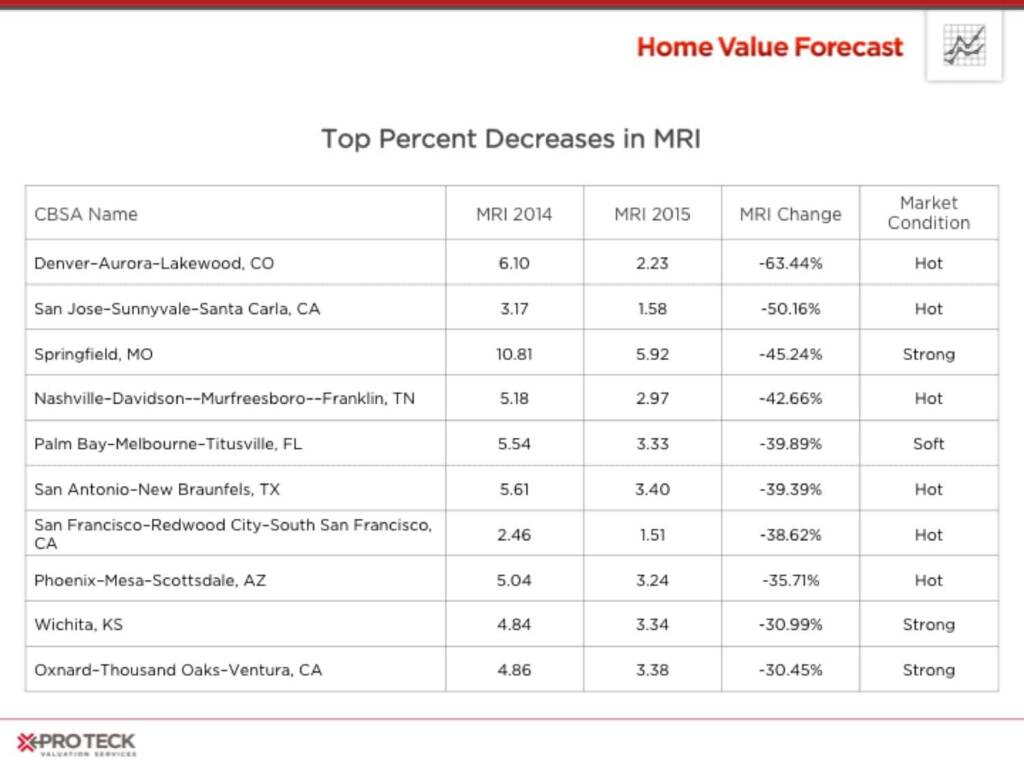
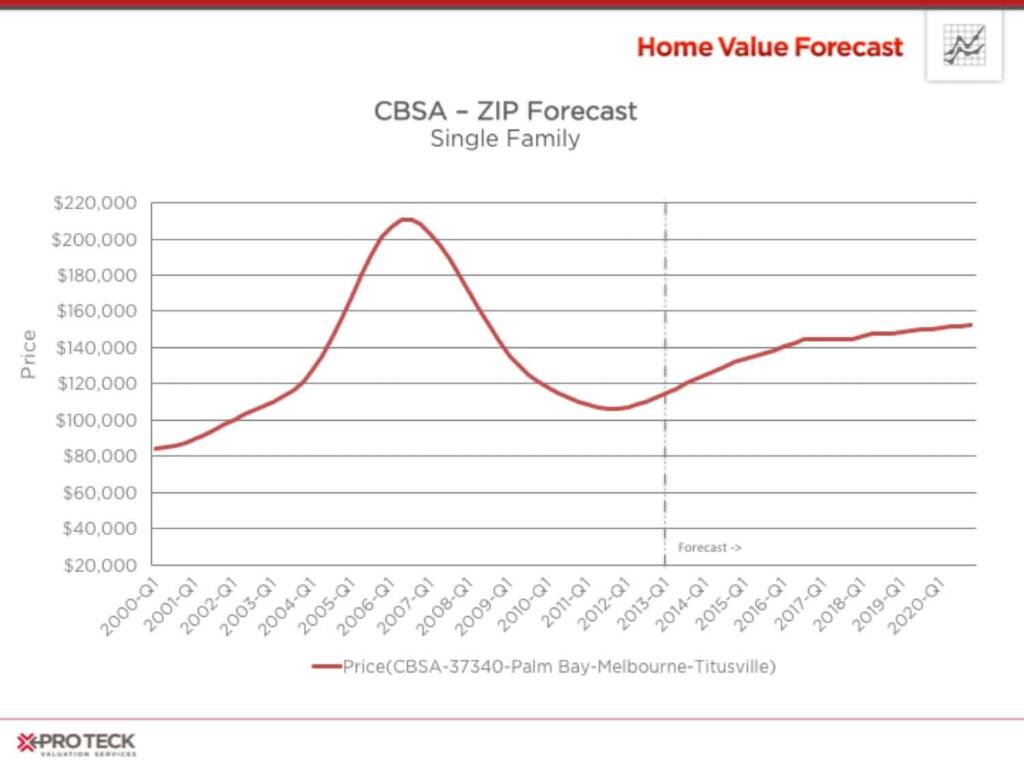
Nine of the top ten percent change leaders have current MRIs of 4 or less, a seller’s market leading to aggressive bidding competition. Of interest is the Palm Bay-Melbourne-Titusville, FL CBSA. While posting a low MRI of 3.33, it is still considered a “soft” market due to having a high percentage of foreclosure sales (22.54% foreclosure sales as a percent of regular sales). This has and will continue to impact appreciation for the foreseeable future, as can be seen in the Collateral Analytics Price Forecast below.
Top Percent Increase in MRI:
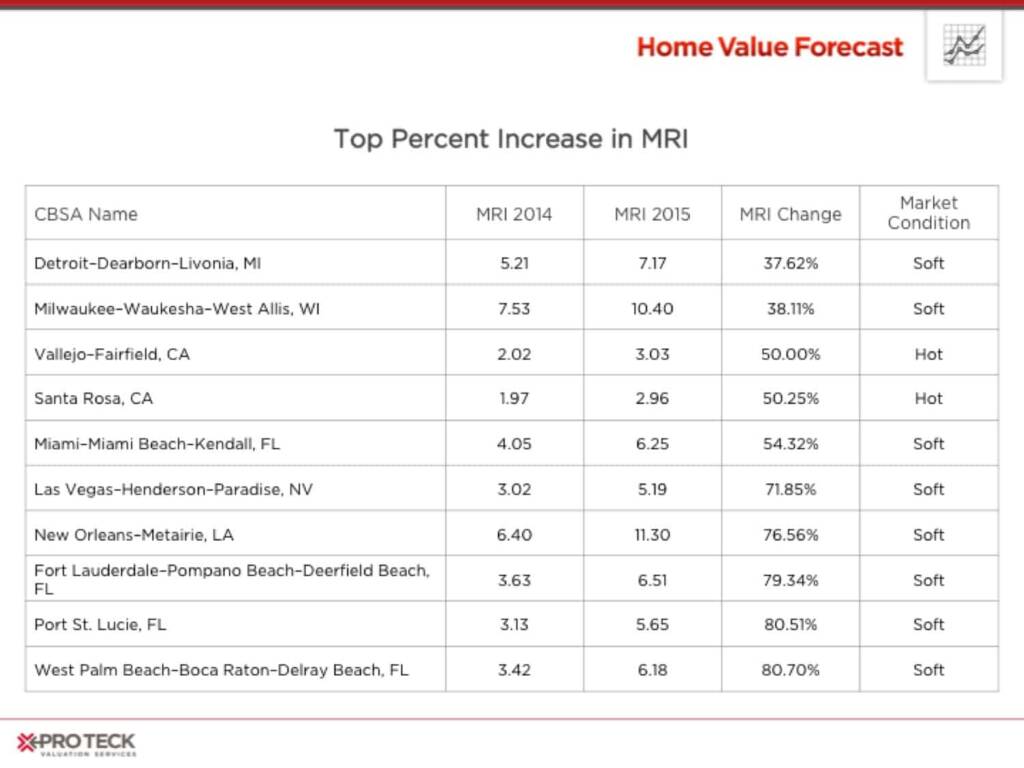
Of the ten CBSAs with rising MRIs, two of them, Vallejo-Fairfield, CA and Santa Rosa, CA, still have sub-4 MRIs, having increased from an MRI around 2 a year ago. We find it astonishing that the metros have MRIs of 3.03 and 2.96 respectively yet find themselves in a listing of top increasers. It’s difficult for a market to sustain a sub-2 MRI, this movement to 4 shows supply and demand starting to better align.
The other eight with the largest increases are all seen as “soft” markets, most due to foreclosure numbers being a larger percentage of sales.
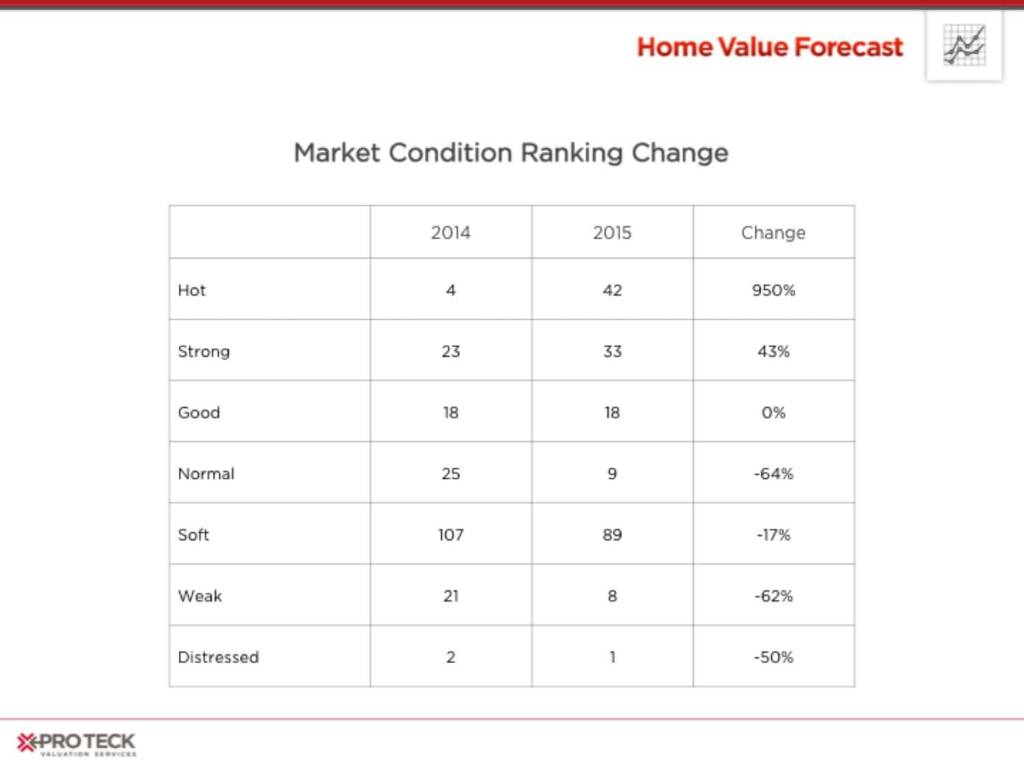
Market Condition Ranking Change
While MRI shows an improvement in the overall health of the U.S. housing market, so does our market rating that analyzes nine data points to rank CBSAs as: Hot, Strong, Good, Normal, Soft, Weak or Distressed.
Below are the market rankings of the 200 CBSAs we track using June, 2014 and June, 2015 data. While there is still work to be done, and while there are still communities suffering, the overall health of the U.S. housing market has dramatically improved.
Here’s hoping for many more years of recovery to come.
CBSA Winners and Losers
Each month, Home Value Forecast uses a number of leading real estate market-based indicators to rank the single-family home markets in the top 200 CBSAs to highlight the strongest and weakest metros.
The ranking system is purely objective and is based on directional trends. Each indicator is given a score based on whether the trend is positive, negative or neutral for that series. For example, a declining trend in active listings would be positive, as will be an increasing trend in average price. A composite score for each CBSA is calculated by summing the directional scores of each of its indicators. From the universe of the top 200 CBSAs, we highlight each month the CBSAs which have the highest and lowest composite scores.
The tables below show the individual market indicators that are being used to rank the CBSAs, along with the most recent values and the percent changes. We have color coded each of the indicators to help visualize whether it is moving in a positive (green) or negative (red) direction.
Top 10 CBSAs:
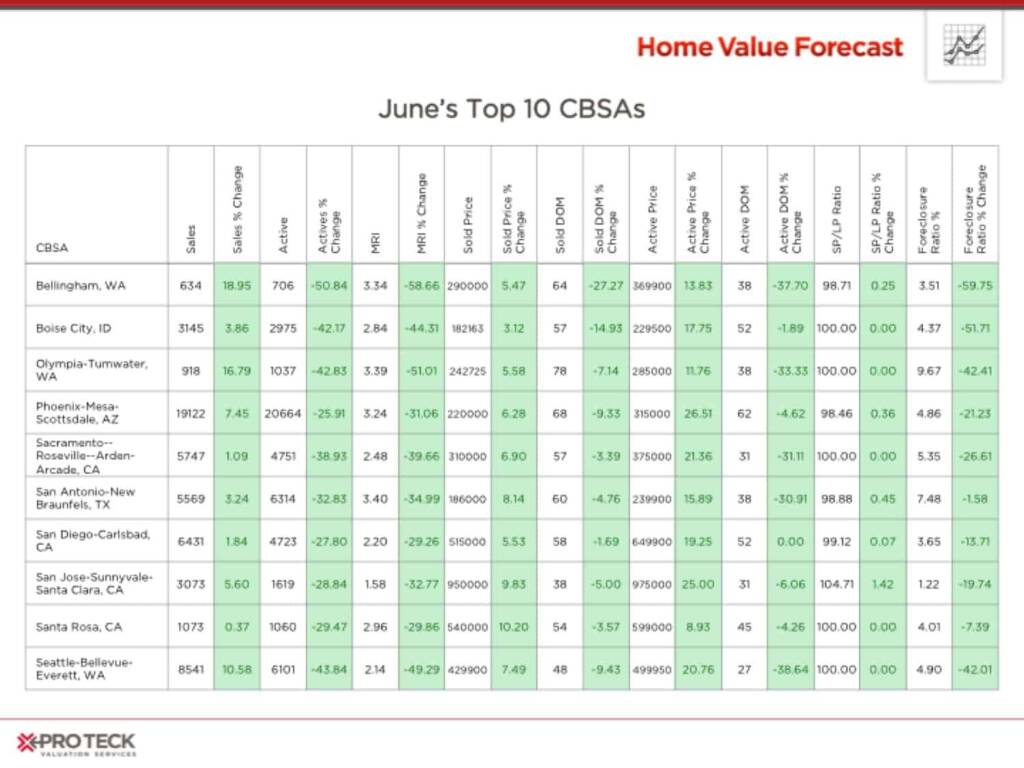
The Western states continue to dominate the top ten with Bellingham, Phoenix and San Antonio rejoining the list. Interestingly there are fewer California markets on this list this month. And continuing on the theme of this month’s updates, all of the top ten MRIs are less than 3.50.
Bottom 10 CBSAs:
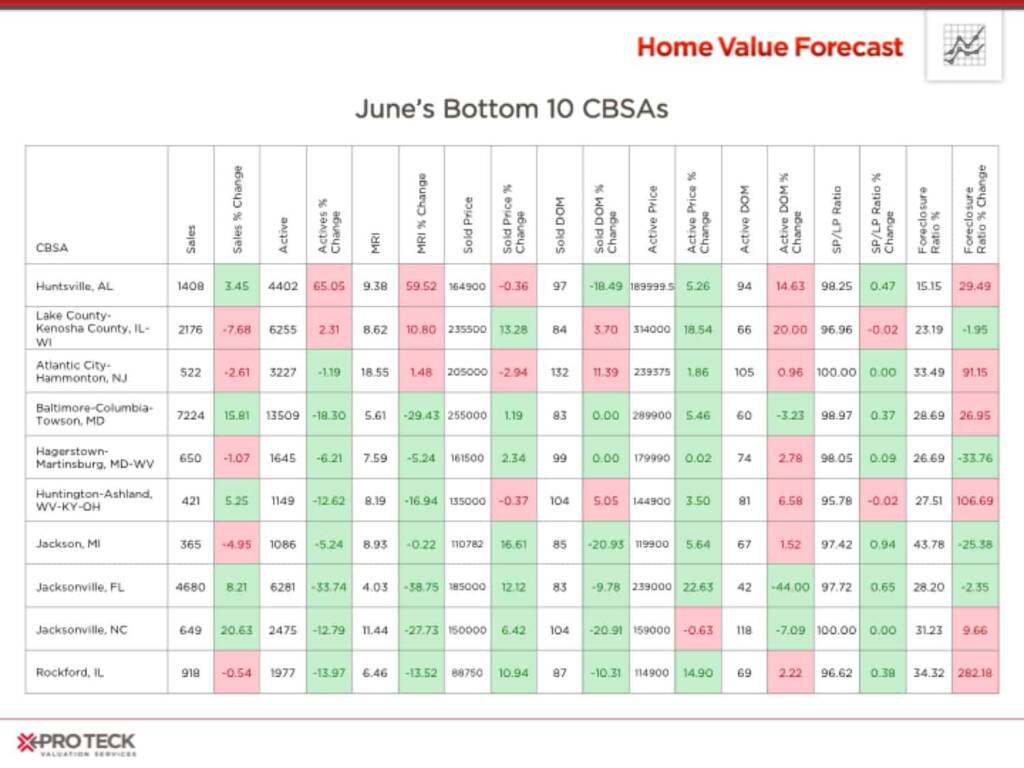
The bottom ten list is virtually unchanged from last month. These communities continue to be plagued by higher percentages of foreclosure sales and higher MRI. Atlantic City, NJ and Jacksonville, NC are seeing MRI over 10 months.
About Home Value Forecast
Home Value Forecast (HVF) is brought to you by SVI. HVF provides insight into the current and future state of the U.S. housing market, and delivers 14 market snapshot graphs from the top 30 CBSAs.
HVF is built using numerous housing and economic data sources. The top 750 CBSAs as well as data down to the ZIP code level for approximately 18,000 ZIPs are available with a corporate subscription to the service. To learn more about Home Value Forecast and SVI’s full suite of residential real estate valuation products, visit Stewart Valuation Intelligence.
The monthly Home Value Forecast update also includes a listing of the 10 best and 10 worst performing metros as ranked by its market condition ranking model. The rankings are run for the single-family home markets in the top 200 CBSAs on a monthly basis. They highlight the best and worst metros with regard to a number of leading real estate market indicators including: sales/listing activity and prices, months of remaining inventory (MRI), days on market (DOM), sold-to-list price ratio and foreclosure percentage and REO activity.
Also, SVI offers reporters the following:
- National, regional or metro level housing data
- Monthly Updates and HVF Insights articles
- By request data for your story – custom data, heat maps and charts are available
- Expert commentary from Home Value Forecast Editorial Committee:
- Tom O’Grady, Chief Executive Officer, Pro Teck Valuation Services
- Michael Sklarz, PH.D., President, Collateral Analytics
- Jeff Dickstein, Chief Appraiser, Pro Teck Valuation Services
About Stewart Valuation Services
SVI s is a national provider of residential real estate valuations. For more than 30 years, we have worked with lenders, loan servicers and investors to improve risk management through superior real estate collateral information. SVI offers a comprehensive suite of services including real estate data and analytics, field valuations, review/due diligence and appraisals. Please visit us at www.proteckservices.com.