Home Value Forecast
Home Value Forecast: Shallow Inventory Pool Driving a Competitive Market
Each month, Home Value Forecast uses a number of leading real estate market-based indicators to monitor single-family home market activity in the nation’s top 200+ metropolitan areas (CBSAs) and report on the Top 10.
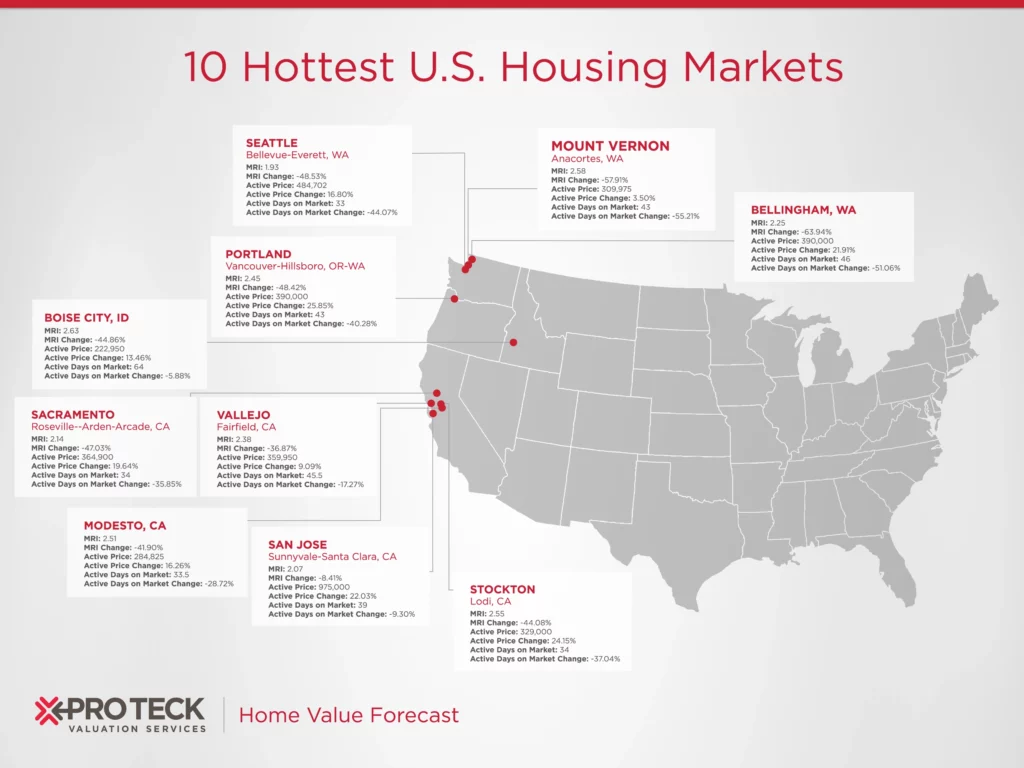
THE TOP 10
The Home Value Forecast Top 10 Hottest Housing Markets ranking system is purely objective and is based on directional trends over the past eight quarters. It’s not a listing of what markets are most expensive or most in need of inventory – it ranks market momentum at a specific point in time.
This month’s Top 10 shows market characteristic uniformity across the board:

Specifically:
- All sales have increased from a year before.
- Active listings are down 56 – 66% in our Top 10. In total, 88% of the CBSAs we track had a decrease in active listings.
- Months of Remaining Inventory (MRI) have dropped 60 – 79%, with the Top 10 all having MRI under 1.3 months, meaning there’s basically four to five weeks of inventory in these markets (a balanced market would have six months of MRI).
- All have an increase in sold price and active price, but a decrease in days on market and foreclosure as a percentage of sales.
As we said in an earlier Home Value Forecast, the pandemic combined with political, social and economic uncertainty are keeping many would-be sellers on the sidelines. If a vaccine is successful early in 2021, we could see more sellers entering the market.
ABOUT SVI’S MONTHLY HOUSING MARKET REPORT
The Home Value Forecast uses a ranking system that is purely objective and is based on directional trends of nine market indicators. Each indicator is given a score based on whether the trend is positive, negative or neutral for that series. For example, a declining trend in active listings would be positive, as would an increasing trend in average price. A composite score for each CBSA is calculated by summing the directional scores of each of its indicators. From the universe of the top 200 CBSAs, each month we highlight topics and trends in the real estate market.