Home Value Forecast
Home Value Forecast: Affordability in Hot Housing Markets
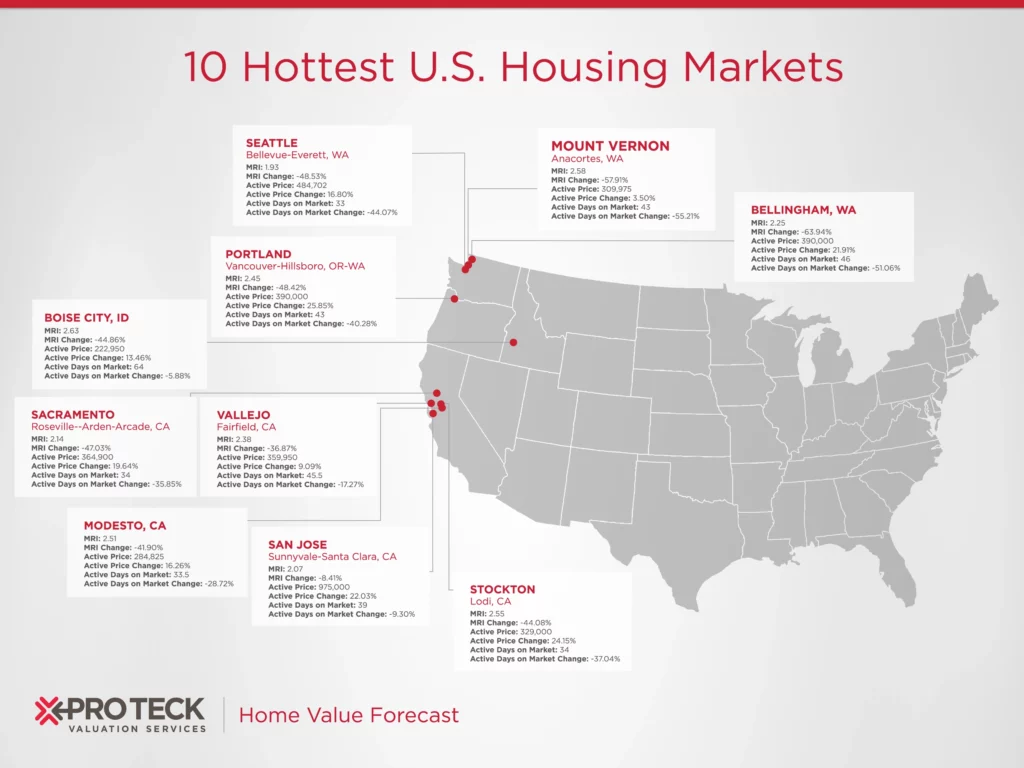
Home Value Forecast’s top ten real estate markets this month are all out west, with five from California and four from Washington state. The west has been leading our forecast for many months, and some people are concerned that these markets may be overheated.
In this month’s edition of the Home Value Forecast we will look deeper into these markets, look at their differences and similarities and what the future might hold.
The Top 10 CBSAs this month are:
- Bellingham, WA
- Boise City, ID
- Modesto, CA
- Mount Vernon-Anacortes, WA
- Portland-Vancouver-Hillsboro, OR-W
- Sacramento-Roseville-Arden-Arcade, CA
- San Jose-Sunnyvale-Santa Clara, CA
- Seattle-Bellevue-Everett, WA
- Stockton-Lodi, CA
- Vallejo-Fairfield, CA
The first thing we wanted to look at was the price history and Collateral Analytics forecast for all ten. To make the trends easier to see we placed the data on two graphs.
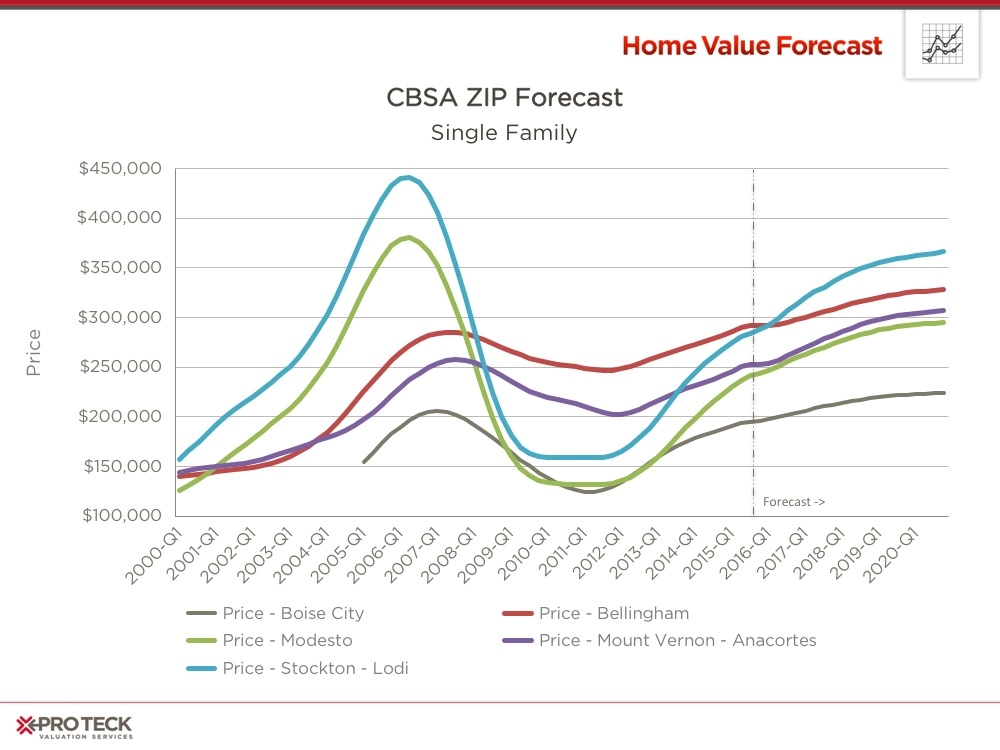
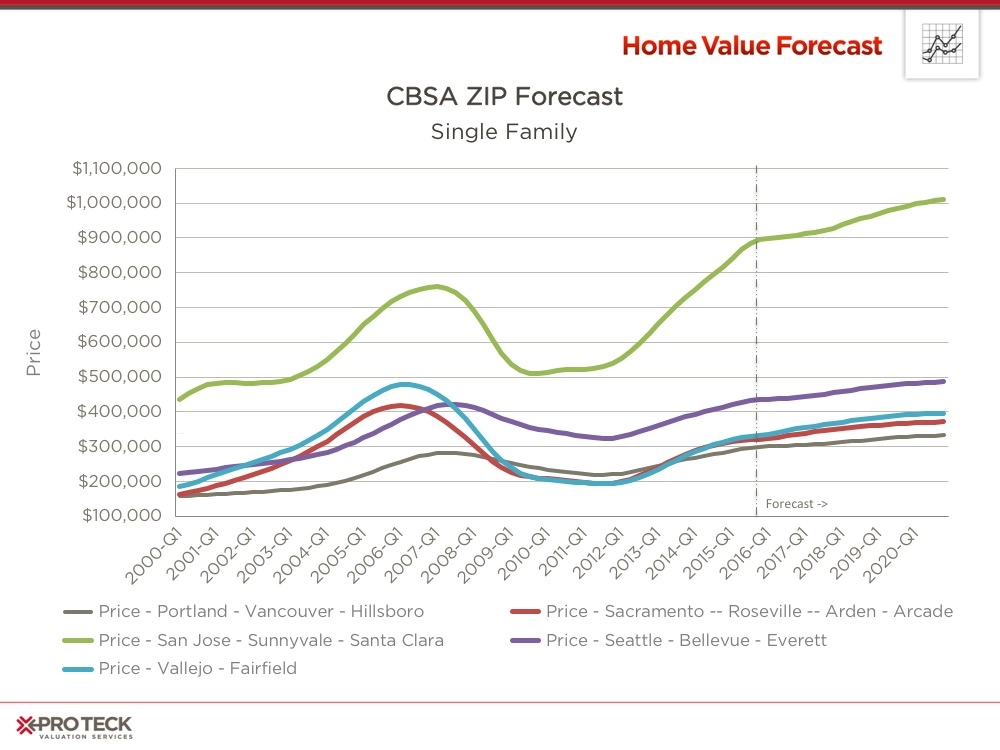
Here’s a closer look at what we found when evaluating the top ten CBSAs:
- 4 out of the 10 CBSAs —Bellingham, Portland, San Jose and Seattle—are now at all-time highs
- 2 out of the 10 CBSAs— Boise and Mount Vernon—are forecasted to hit new highs by Q1, 2017
- 4 out of the 10 CBSAs— Modesto, Stockton, Sacramento, Vallajo—are not forecasted to exceed pre-crash highs in the next five years
Affordability
The first question people ask is whether there is a bubble on the horizon for any of these communities. While there are many factors that can impact a “bubble” one of the most important factors at Home Value Forecast is looking at home affordability via an affordability index.
Affordability is derived by looking at the median income for a particular area as a ratio to the mortgage payment needed to purchase a median priced home. An index score above 100 signifies that a household earning the median income has more than enough income to afford the mortgage. Lower scores suggest more income is needed to cover mortgage expenses. The Collateral Analytics Affordability Index used by Home Value Forecast also looks at loan-to-value norms for a particular area to adjust for more affluent buyers usually putting more money down. Below are the affordability indexes for San Jose and Stockton, two of our top ten communities.
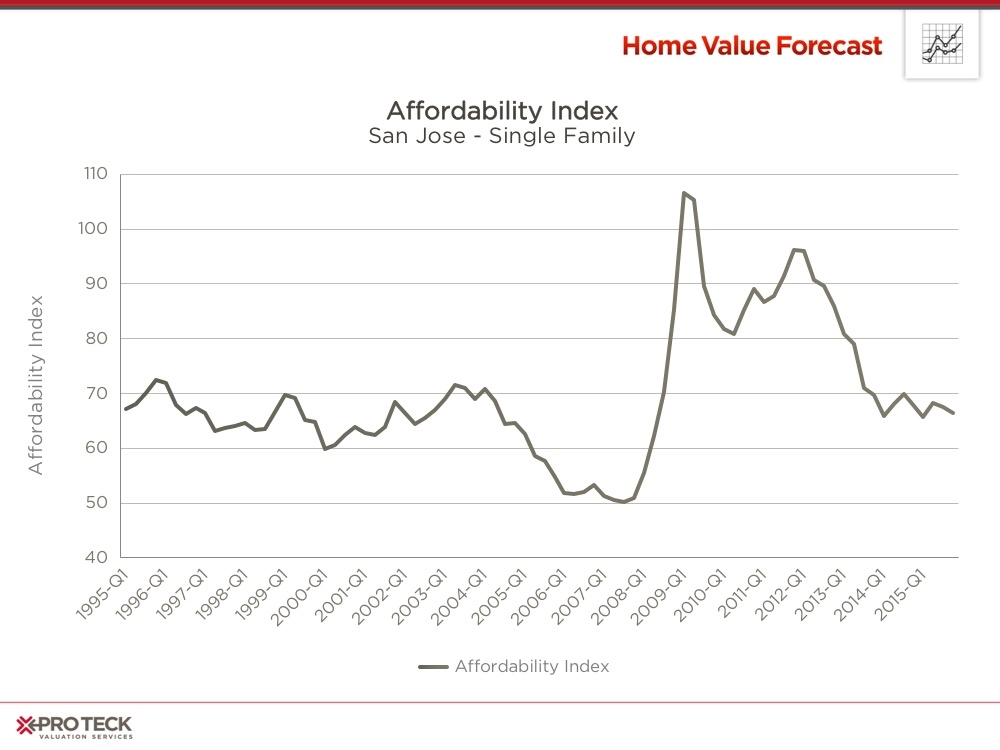
Since the mid-nineties San Jose has been an expensive place to live, with historic affordability index readings averaging 70. In the past two years, San Jose has returned to the 70 average, showing that income has increased to meet historic norms for the area. If it drops into the 50s, like it did 2005-2007, we might again have an issue.
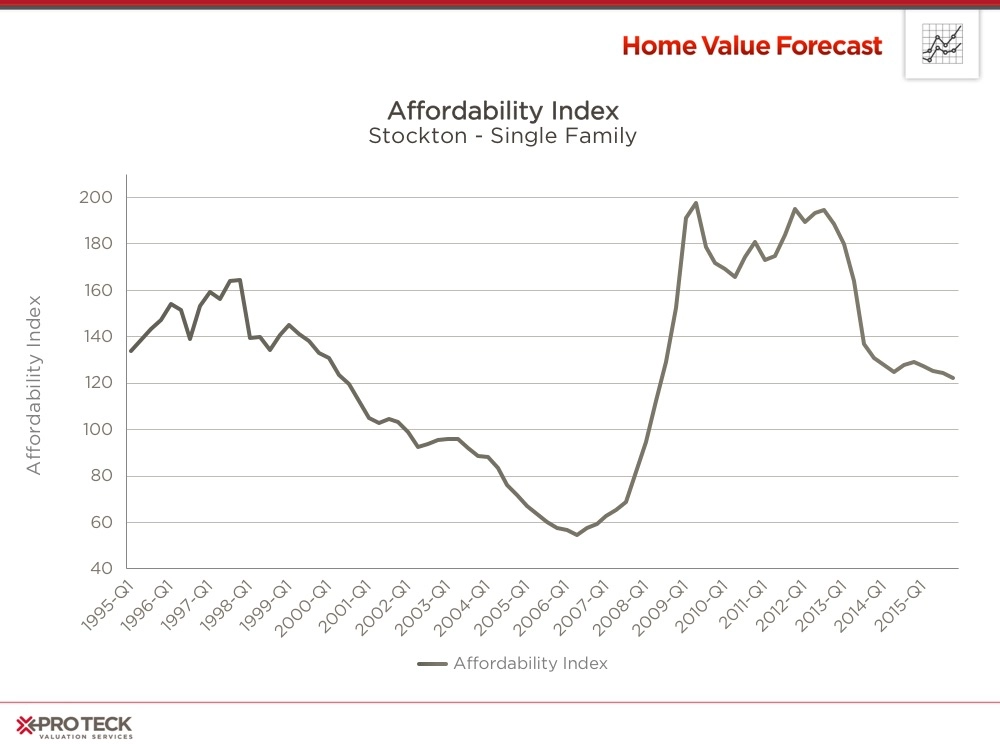
Stockton has been a more affordable place to live, averaging an index over 100 until 2001. From 2004-2007 Stockton saw its affordability index drop sharply to the 60s, non-sustainable with its economic base.
The above are examples of what we see for all of our top ten CBSAs – while home prices are increasing, affordability is at or above historic norms and nowhere near “bubble” territory of 2004-2007.
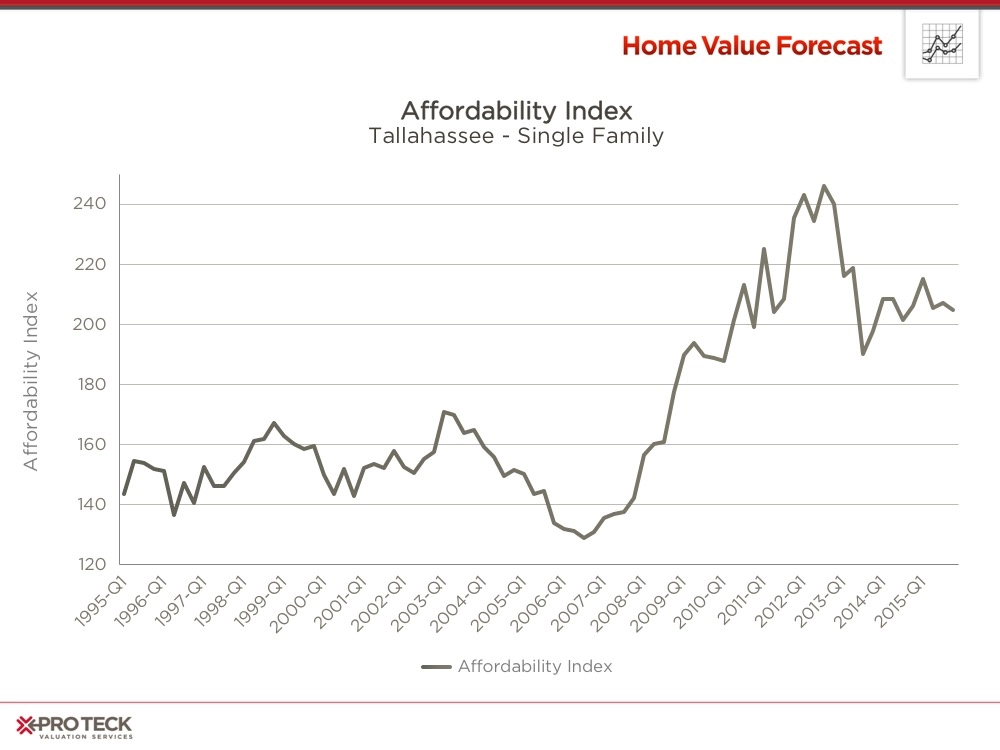
For comparison, below is the index for Tallahassee, FL, one of our bottom ten CBSAs this month. As the community continues to heal we believe its affordability index will return to the 160 range.
The Impact of REO on Recovery
So what makes San Jose (all-time high) and Stockton’s (prices not yet rebounded) recovery so different? One place to look is the impact of REO sales on the market.
Below are graphs showing the number of REO sales as a percentage of regular sales for both San Jose and Stockton.
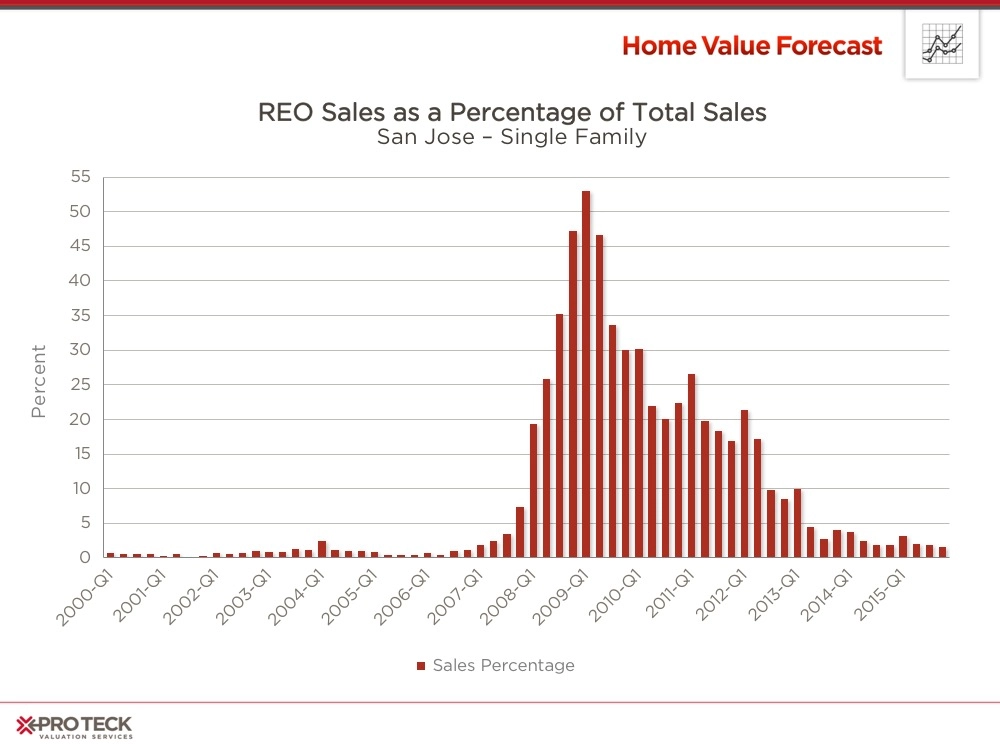
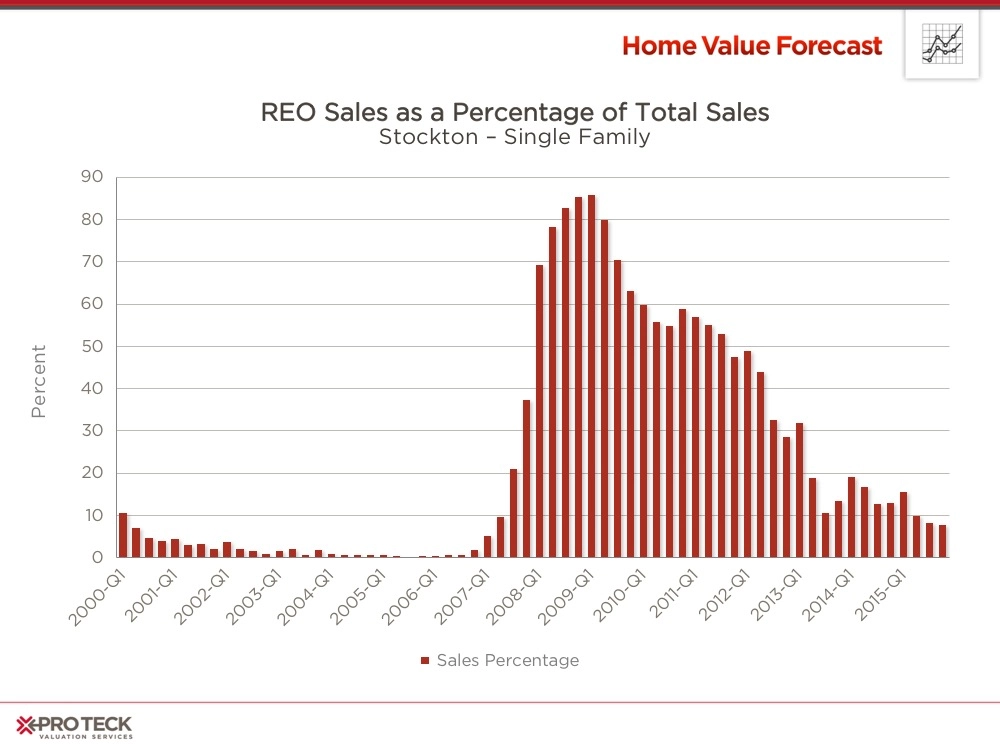
California is a non-judicial foreclosure state, meaning that lenders do not have to go to court in order to foreclose on a home. This caused a quicker spike in foreclosures, having a swift and decisive impact on real estate prices.
San Jose spiked to over 50% REO sales while Stockton hit over 85% at its height. Both of these had a dramatic impact on home prices, as REOs sell for a discount, bringing all housing pricing down. Obviously, with 85% being discounted in Stockton, the impact was more dramatic and longer lasting.
San Jose rebounded to market norm sub-5% REO by Q2, 2013 while Stockton is closing in on norm, at 7.75% as of Q3 2015.
As a comparison, lets look at Tallahassee, Florida, a community in our bottom 10 this month:
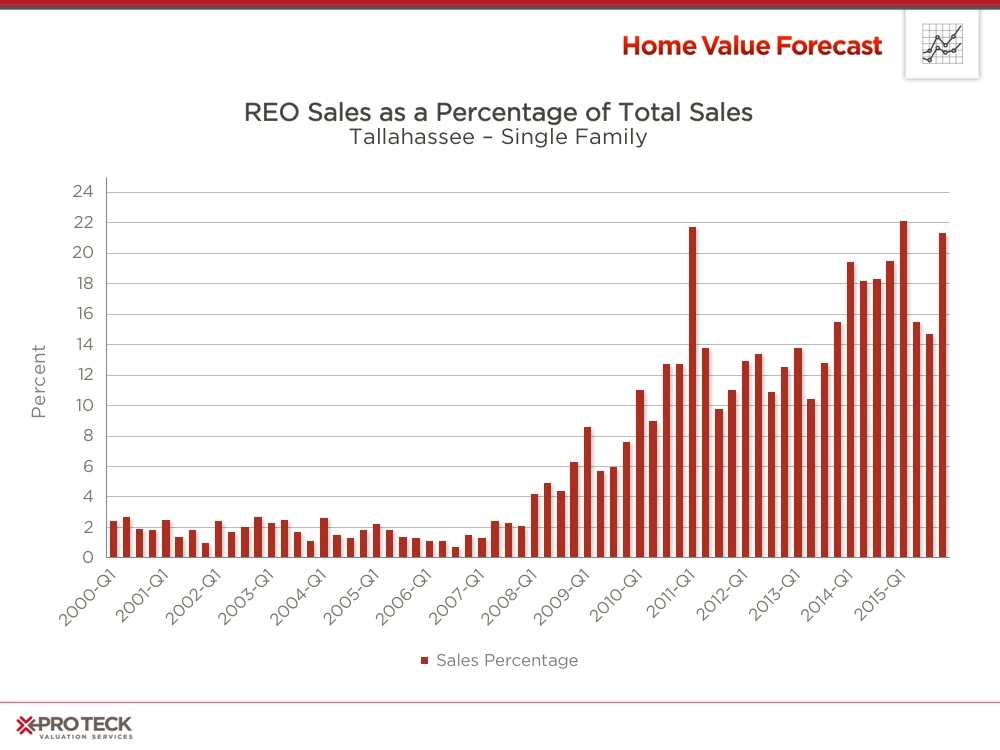
Florida is a judicial state, meaning that every foreclosure must cycle through a court proceeding before being eligible for purchase (unlike California, where speedier non-judicial foreclosures cleared up the bulk of REO inventory earlier). This judicial process adds a substantial amount of time to the process (up to 2 years) and slows down the speed of a recovery.
Tallahassee has been averaging over 18% REO as a percent of sales for the last 2 years, and over 10% for the last six. This drags a recovery over a longer period of time.
So why was Stockton impacted more to the downturn? The answer can be seen in the loan to value ratio.
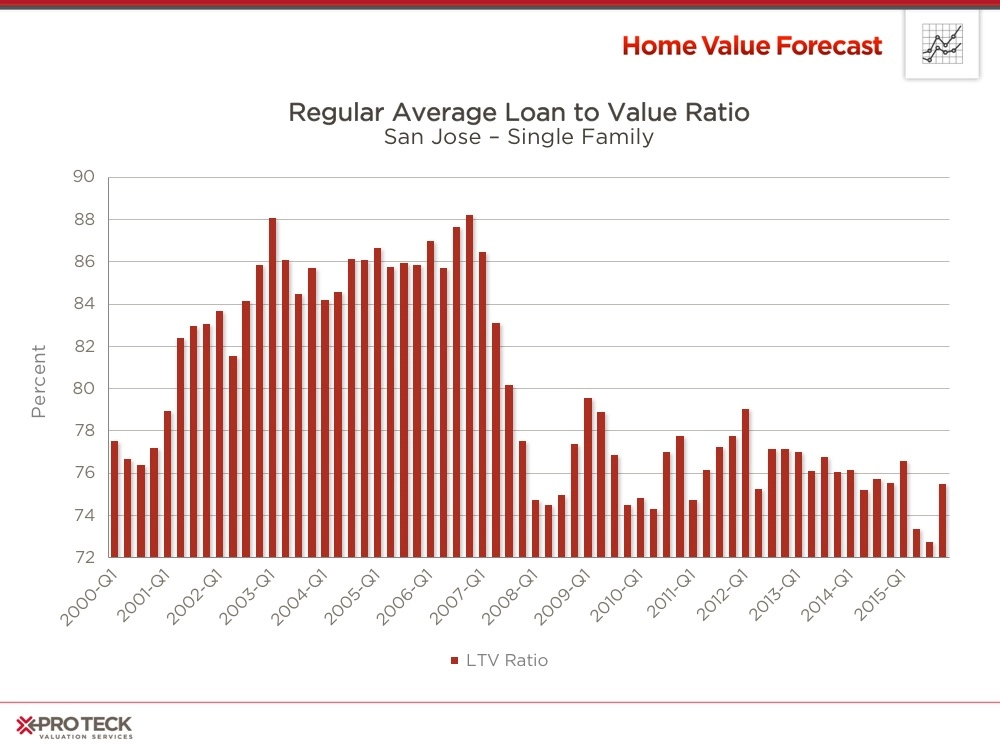
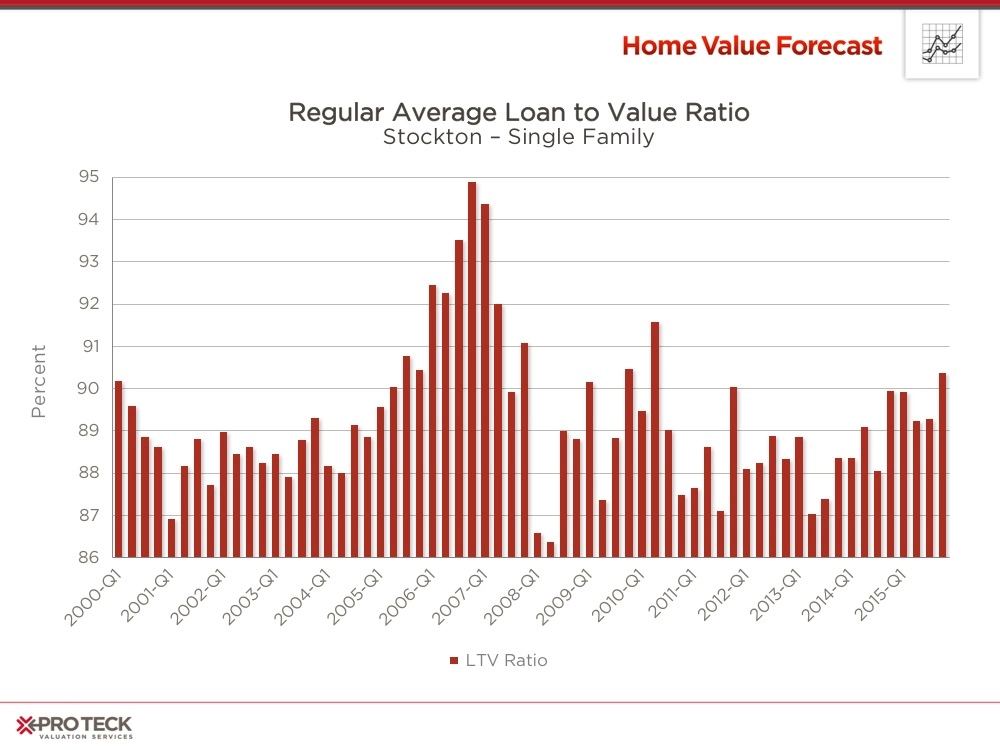
While Stockton’s loan to value has always been close to 90%, peaking at 95% as the housing crisis began, San Jose has been closer to 80%, to a low of approximately 75% today. Highly leveraged loans meant more defaults in Stockton, leading to a steeper decline in prices and a slower recovery. With loan to value still at 90% today, one could surmise that Stockton could benefit greatly by the loosening of credit policy to make more people eligible for loans.
San Jose, on the other hand, has higher home prices and larger down payments. The people buying here have the money and credit rating needed to get the best loans, leading to faster home appreciation.
We will keep our eye on these communities to gauge the impact changes to interest rate or credit policy might have on their recoveries.
CBSA Winners and Losers
Each month, Home Value Forecast uses a number of leading real estate market-based indicators to rank the single-family home markets in the top 200 CBSAs and highlight the strongest and weakest metros.
The ranking system is purely objective and is based on directional trends. Each indicator is given a score based on whether the trend is positive, negative or neutral for that series. For example, a declining trend in active listings would be positive, as will be an increasing trend in average price. A composite score for each CBSA is calculated by summing the directional scores of each of its indicators. From the universe of the top 200 CBSAs, we highlight each month the CBSAs which have the highest and lowest composite scores.
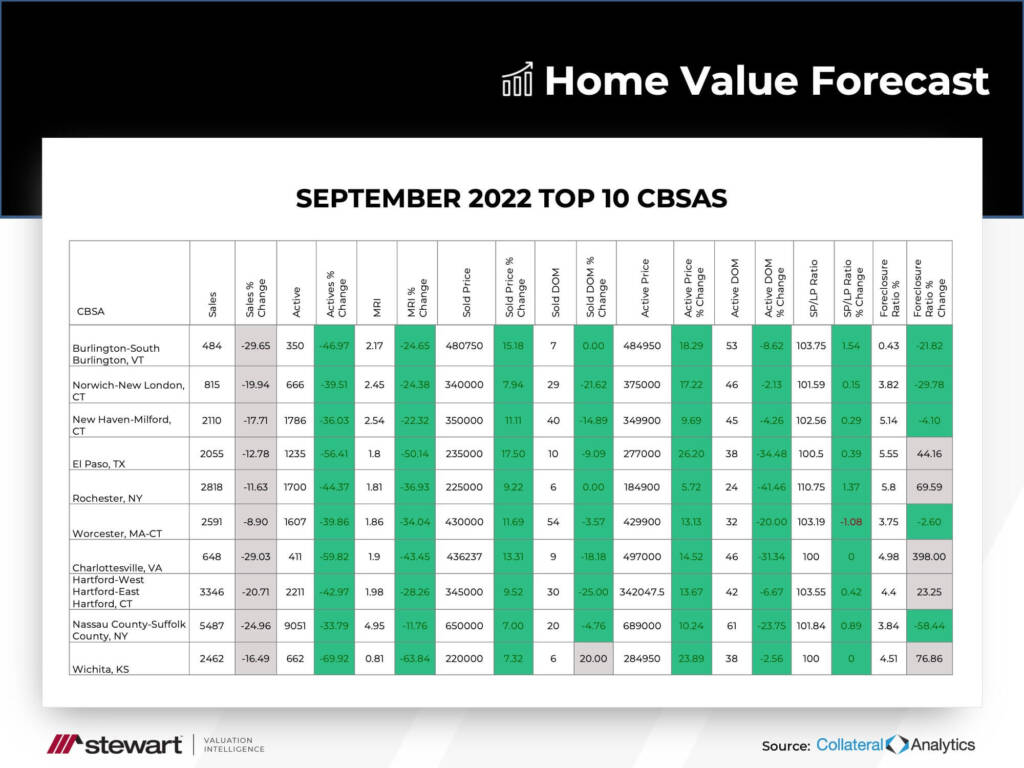
The tables below show the individual market indicators that are being used to rank the CBSAs, along with the most recent values and the percent changes. We have color-coded each of the indicators to help visualize whether it is moving in a positive (green) or negative (red) direction.
Top 10 CBSAs:
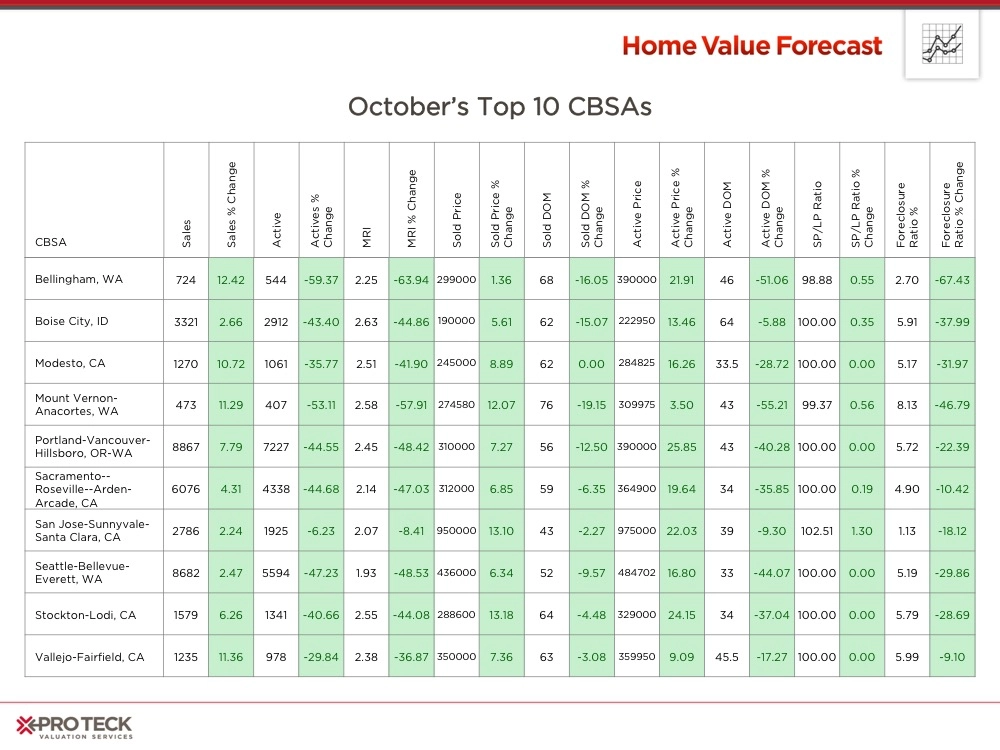
The top ten are all impacted by lack of inventory, with all having a drop in the percent active listings, MRI and days on market.
Bottom 10 CBSAs:
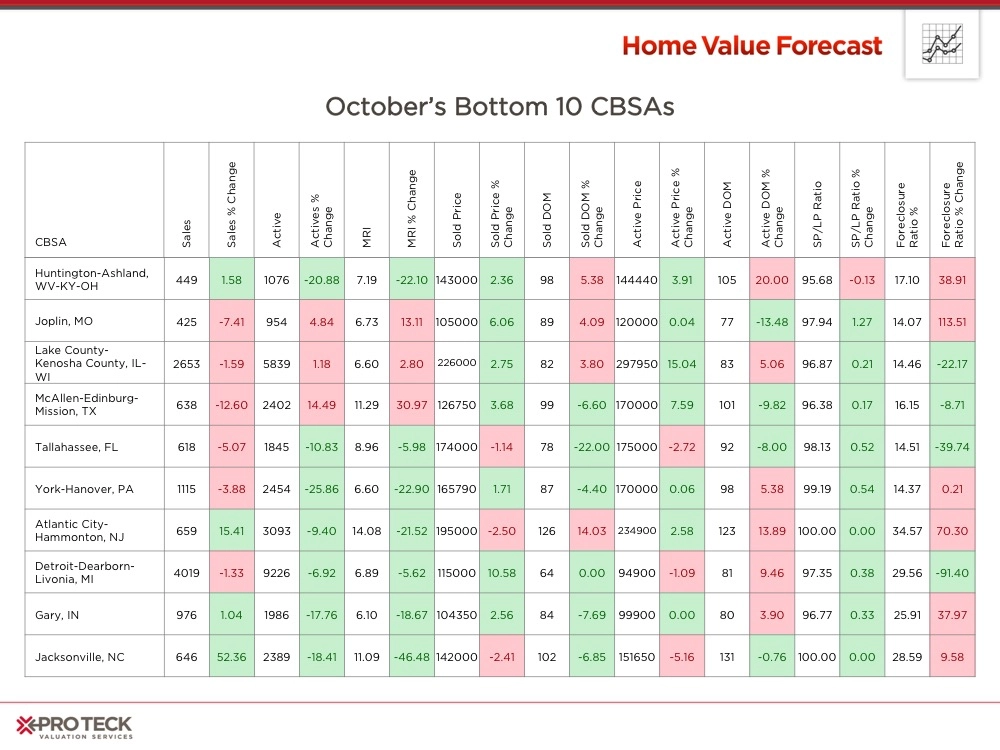
Over the last year we have seen the mix of our bottom 10 change as the recovery has progressed. While foreclosure as a percentage of sales is still high for these, from 14-34%, they are much smaller than a year ago. We will take a deeper look at yearly changes in next month’s forecast.
About Home Value Forecast
Home Value Forecast (HVF) is brought to you by Pro Teck Valuation Services. HVF provides insight into the current and future state of the U.S. housing market, and delivers 14 market snapshot graphs from the top 30 CBSAs.
HVF is built using numerous housing and economic data sources. The top 750 CBSAs as well as data down to the ZIP code level for approximately 18,000 ZIPs are available with a corporate subscription to the service.
Also, Pro Teck Valuation Services offers reporters the following:
- National, regional or metro level housing data
- Monthly Updates and HVF Insights articles
- By-request data for your story — custom data, heat maps and charts are available
- Expert commentary from Home Value Forecast Editorial Committee:
- Tom O’Grady, Chief Executive Officer, Pro Teck Valuation Services
- Michael Sklarz, PH.D., President, Collateral Analytics
- Jeff Dickstein, Chief Appraiser, Pro Teck Valuation Services