In today’s mortgage market, appraisals are used to determine a specific price point and market condition of a property, which are then used to determine if a loan will be approved, how much will be lent and the cost of that loan. By taking advantage of the amount of market data and analytics available, a more sophisticated risk-based appraisal can be provided to improve pull through ratios while better protecting homeowners and investors with risk-based pricing.
There are two specific areas where appraisal products can be improved upon: establishing a range of value and providing better supported, more accurate market condition conclusions. We will discuss how each area can be improved upon and conclude with some thoughts on how those improvements will enable better risk-based underwriting. First let’s look at the concept of establishing a range of value.
All homes have a range of prices for which they may sell at any point in time, and even in very homogeneous active markets that range can easily run plus or minus 5 percent. Depending on the uniqueness of the neighborhood, a plus or minus range of 10 percent should not be unexpected. This means a home with an average value of $300,000 may be valued between $270,000 and $330,000. Why do we observe market price uncertainty?
There is a range of prices over which any particular property will sell at any point in time. Most of the reasons for price dispersion for very similar property are well known, but not well-documented. They include:
1. Tastes and preferences differ and while many properties are fairly comparable, there are still nuances and décor that influence value to unique buyers that remain unobservable. The more unique and custom the home, the greater we should expect the variance on opinions of value. Even homogeneous homes may have several nuances that are unique, such as location on the street, orientation to the sun, an old stately large shade tree, a strange choice of interior paint or carpet colors.
2. Unobserved variables are always a possible source of value estimate distortions. Beyond the standard checklist of age, size, bedrooms, baths, fireplaces and the like, we may have unobserved features such as extraordinary wine racks, custom sound systems, extra thick walls with added insulation, higher quality windows, high quality wall art murals or painted ceilings, cedar closets, and a whole host of features that maybe be atypical for the neighborhood.
3. Inaccurate information. Many homeowners fix up basements, add built-in features, remodel kitchens and bathrooms, but do not pull a building permit (as required by law). While there is some risk to this behavior, the owner may be trying to keep property taxes lower and so is motivated to ignore the law. The result is that an added bathroom or remodeled kitchen does not show up in the public records. It may show up in multiple listing system (MLS) data or elsewhere, but there may be errors in the MLS data or omissions, some intentional by real estate agents. An ocean view may be shot via a large telescopic camera lens that makes it look like a property sits right over the ocean. Reality suggests that there are trees and telephone lines in the way and that the sliver of an ocean view is miles away.
4. Urgency to buy/sell adds to price dispersion. Buyers who have a short time window in which to contract for a home, such as on a few weekend visits, may not have as much information as in-town buyers. Timing factors, such as school start or a new job combined with search costs like flights and hotels can result in the decision by some to buy with less information.
The same is true on the seller side. An urgent need to move, cash out, or a make a quick closing all hurt the negotiating ability of the seller and result in a lower than average price. Given these different urgencies to buy or sell, it is rational for these atypical buyers and sellers to pay more or receive less than normal for their home.
5. Distress sales may be included as one where selling costs are high but there may be other factors including stigma, or the lack of warrantees that affect discounts for such sales. The discounts have ranged from 20 percent to much higher depending on the market, adding to price dispersion and uncertainty about value. [1]
6. Financing is well established as a cause of price variation, such as FHA or VA when the seller pays points and in turn requires a higher price than on conventional transactions. Seller financing at below market rates, while rare today, in periods of higher interest rates will be another source of price distortion.
7. Seasonality is well-established as a factor driving sales volume, but seasonality also influences sales prices. We observe in many markets a plus or minus 5 to 10 percent range over of the course of a year.
8. Thin markets always present a problem, making comparisons difficult and some localized markets reveal little transaction volume. Indeed, this is probably at the heart of the matter in declining markets.
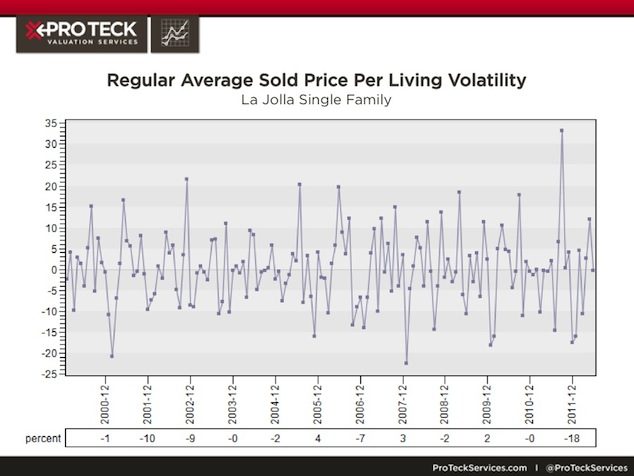
Given the factors above that can make value estimation difficult, how much volatility should we expect as a function of the heterogeneity of the market? While not a scientific study, we chose two extreme examples of housing markets to illustrate the point that any given house trades over a range of prices. This range is naturally larger in unique markets like La Jolla, California where all the homes are high-end custom homes and smaller in markets like ZIP code 08757, in Toms River, New Jersey, where size and age variation are minimal. We show Bing aerial maps of these two submarkets below.
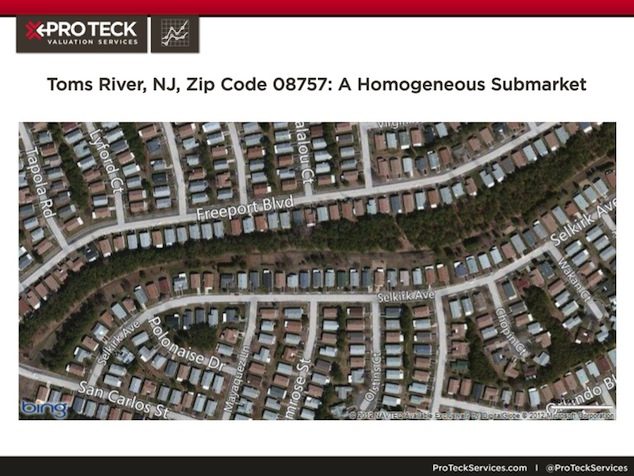
Exhibit 1: Toms River, NJ, Zip Code 08757: A Homogeneous Submarket
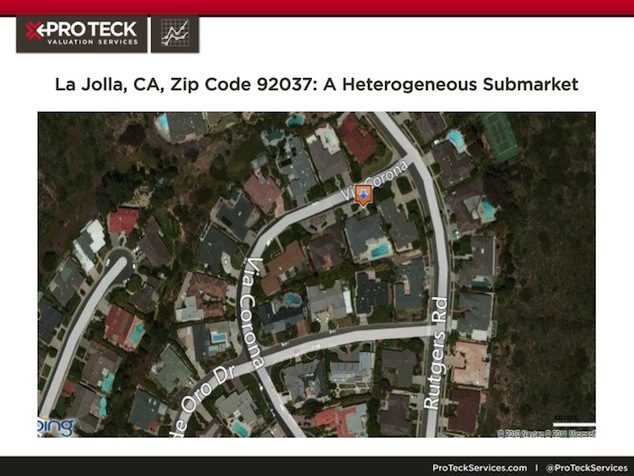
Exhibit 2: La Jolla, CA, Zip Code 92037: A Heterogeneous Submarket
In Toms River (ZIP 08757) every month there are typically 50 to 140 sales. In La Jolla (ZIP 92037), the sales per month run also run about 50 to 135 per month.
A wide variety of statistical measures can be used to gauge value uncertainty. Home Value Forecast uses Collateral Analytics AVM models, which do this with its confidence interval. One approach employed in this article is based upon a process that seeks to identify trend lines in the historical data leading up to the date of the appraisal. This is done by applying a Hodrick-Prescott Filter to the price per square foot of all the sales in a ZIP code. The result shows the typical noise or price dispersion around the trend.
We see that the ZIP code in Toms River has about half the volatility of La Jolla, but is still is about plus or minus 5 percent. This particular ZIP code was selected because it was the most homogeneous out of some 15,000 urban ZIP codes with an active market based on significant sales volume.
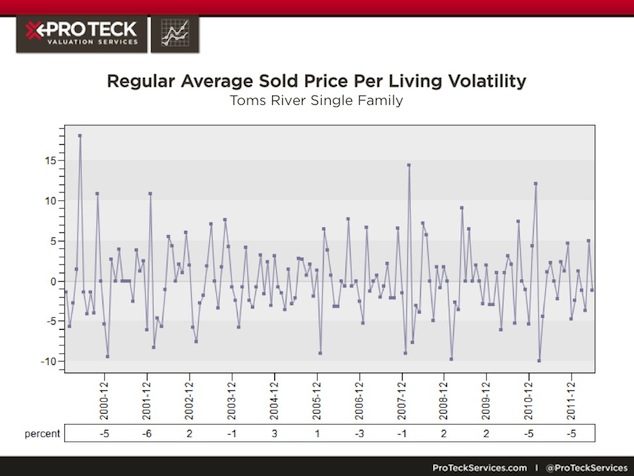
By comparison we observe plus or minus 10 to 15 percent in the La Jolla zip code selected.
The second area that can improve appraisals is the Market Condition Addendum (form 1004MC), required by Fannie Mae and Freddie Mac as of April 1, 2009, for all 1-4 unit properties.
The purpose of the addendum is to provide support for market trends and conditions conclusions for the subject’s neighborhood. The form requires an analysis of inventory as well as trends in median sale price, list price, days on market (DOM), Sale-to-List price ratio, and impact of foreclosures and REO’s. The appraiser needs to perform a statistical analysis to determine if each of these market indicators is representative of a declining, stable or increasing overall trend in neighborhood property values, and then draw a market conclusion. Developing the most accurate and supported Market Condition conclusions can be aided with analytical tools developed to assist the appraiser in analyzing a potentially large set of market data and ensuring calculations are consistent and accurate providing the user of the appraisal with a higher level of confidence in the final determination of declining vs. stable vs. increasing.
Appraisals with market condition addendums based on incomplete data or faulty trend information may lead to wrong conclusion that can negatively impact a loan when an increasing market is misreported as stable or decreasing and vice versa. Collateral Analytics, a partner in Home Value Forecast, has developed automated analytics that can be used by the appraiser to provide a more consistent, accurate and robust neighborhood analysis.
CONCLUSIONS
All homes have a range of prices over which they may sell at any point in time and even in very homogeneous active markets that range can easily run plus or minus 5 percent. Perhaps it is time to provide a confidence band range in addition to the appraiser’s point value. Add to this a more accurate market condition conclusion and we can shed light on the relative riskiness of a particular estimate of the loan-to-value ratio, a common use of appraisals. Such improved risk-based underwriting will better protect both homeowners and investors.*
Let’s take the example from earlier of the property appraised at $300,000 in a neighborhood with a price dispersion of 10 percent, meaning the property could sell from $270,000 to $330,000. Let’s say market condition analytics show the property to be in a declining market. If it’s an 80 percent LTV loan maybe the risk is acceptable if a higher interest rate is used to offset the declining market, knowing the value range has $30,000 of potential upside to the value.
On the other hand, if it’s an increasing market and the borrower is looking to pay $330,000 with 20 percent down, maybe the risk is acceptable to make that loan even though the appraiser’s point value is $300,000. This is with the knowledge that there is $30,000 of potential upside in the loan, and the market condition indicates an expected increasing trend in value. Without a fully risked-based appraisal, this loan would be declined today for inadequate value.
[1] See for example “Distressed Home Prices – the true Story” By Miller and Sklarz in Mortgage Banking, March 2009. Many other papers on this topic are worthwhile. See for example, “The Value of Foreclosed Property,” by Anthony Pennington-Cross, Journal of Real Estate Research, 2006, 28(2), 193-214.
* In fact, Follain and Sklarz (2005) previously developed a model that incorporated the confidence interval into the evaluation of the credit risk of a mortgage. The larger the confidence interval, the greater the credit risk to a lender, especially for high LTV loans, and the higher the interest rate the lender may wish to charge. Their model also incorporated another critical source of uncertainty – the path of future house prices; the more uncertain the future, the higher the rates that lenders will wish to charge, all else equal. Both the uncertainty of the current price and its future path are important drivers of financially sound lending.
………………………………………………………………………………………………..
James R. Follain, Ph.D.
James R. Follain LLC and Advisor to FI Consulting
jfollain@nycap.rr.com
Norm Miller, PhD
Professor, Burnham-Moores Center for Real Estate
University of San Diego
nmiller@sandiego.edu
Michael Sklarz, Ph.D.
President
Collateral Analytics
msklarz@CollateralAnalytics.com
About SVI’s Monthly Housing Market Report
The Home Value Forecast uses a ranking system that is purely objective and is based on directional trends of nine market indicators. Each indicator is given a score based on whether the trend is positive, negative or neutral for that series. For example, a declining trend in active listings would be positive, as would an increasing trend in average price. A composite score for each CBSA is calculated by summing the directional scores of each of its indicators. From the universe of the top 200 CBSAs, each month we highlight topics and trends in the real estate market.
