Home Value Forecast
Home Value Forecast: Market Conditions Impacting Sold Days on Market in Nation’s Top Metros
You found the home of your dreams – now how long until you move in?
A recent study suggests that closing times are getting longer, now averaging 50 days. This may seem like a long time, but looking at all the steps needed — from inspection, appraisal, underwriting, documentation, title and home insurance to eventual close, you can see that it takes time. Add to this list buyer/seller contingencies, repairs, etc., and 50 days can double or more.
Last month we discussed how the lack of inventory is impacting the home selling season, and how fierce competition is driving home price gains. Another impact we are seeing towards the top of our ranking is a decrease on Sold Days on Market (the time from listing to close).
This month’s Home Value Forecast examined the 200+ metros included in the report and found seven of the markets tracked have Sold Days on Market at or under the 50 day closing average – meaning in these metros homes are going under contract fast, often during the first few days on the market. The seven markets include:
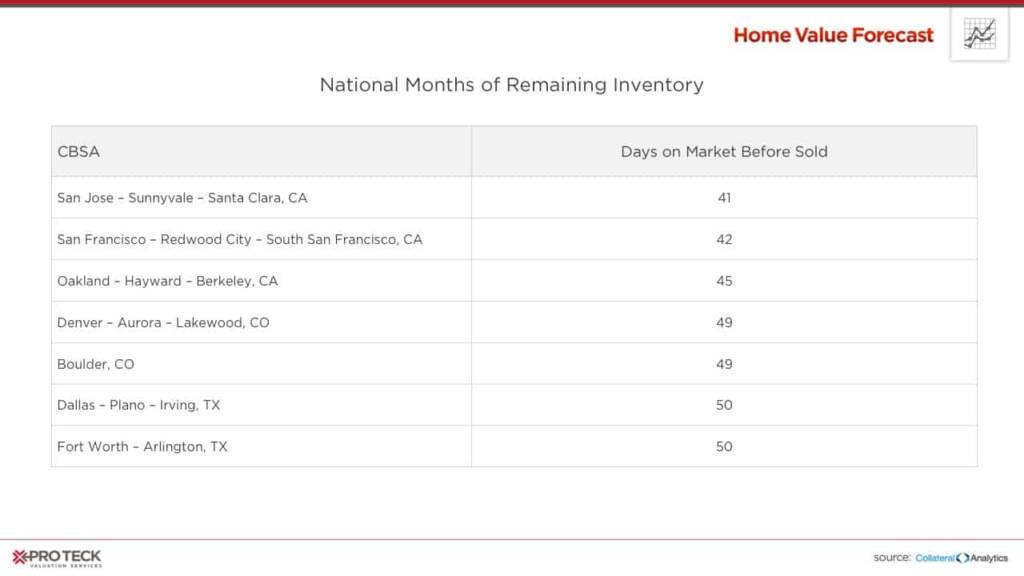
What does this mean? In these markets, multiple bids are coming on listing day. To be competitive, winning bidders are pre-approved, have no contingencies and often have larger down payments – all leading to less risk and a quicker close with the banks. Out of the 200+ CBSAs we track, San Jose, CA has the lowest Sold Days on Market. Let’s take a closer look at what factors may be contributing to this.
What’s the Story in San Jose, CA?
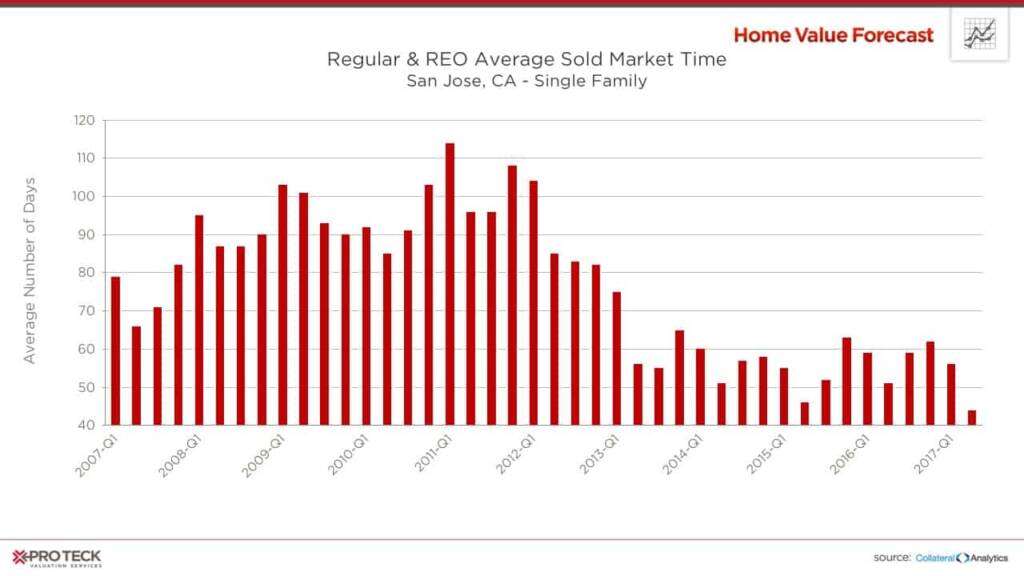
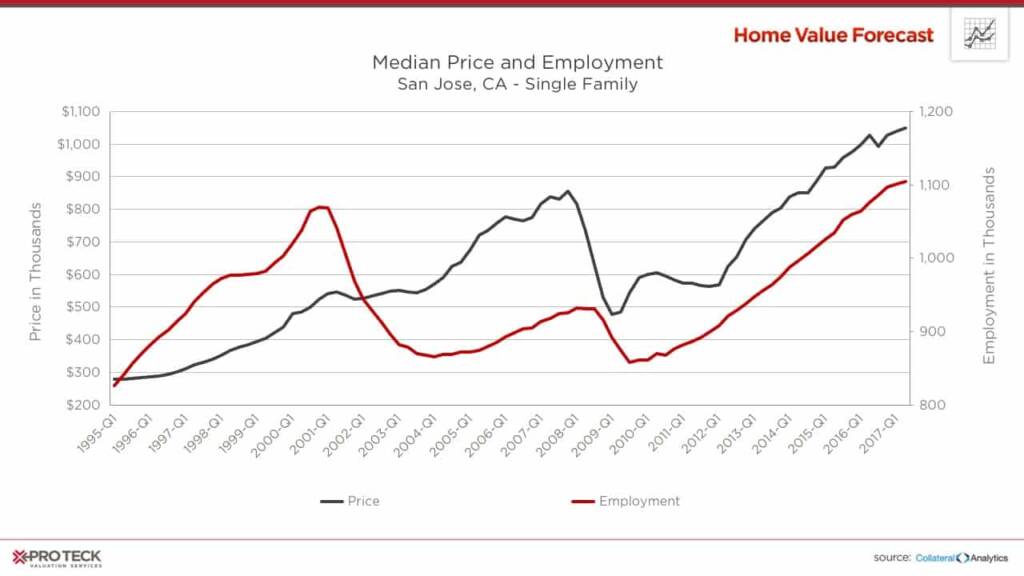
Quicker closing days in San Jose, CA have been the norm for the last few years, with dips to the 50-day range each of the last few years during Q2. With the lack of inventory and increasing employment in San Jose, we don’t see these market dynamics changing anytime soon.
CBSA Winners and Losers
Each month, Home Value Forecast uses a number of leading real estate market-based indicators to rank the single-family home markets in the top 200 CBSAs and highlight the strongest and weakest metros.
The ranking system is purely objective and is based on directional trends. Each indicator is given a score based on whether the trend is positive, negative or neutral for that series. For example, a declining trend in active listings would be positive, as will be an increasing trend in average price. A composite score for each CBSA is calculated by summing the directional scores of each of its indicators. From the universe of the top 200 CBSAs, each month we highlight the CBSAs which have the highest and lowest composite scores.
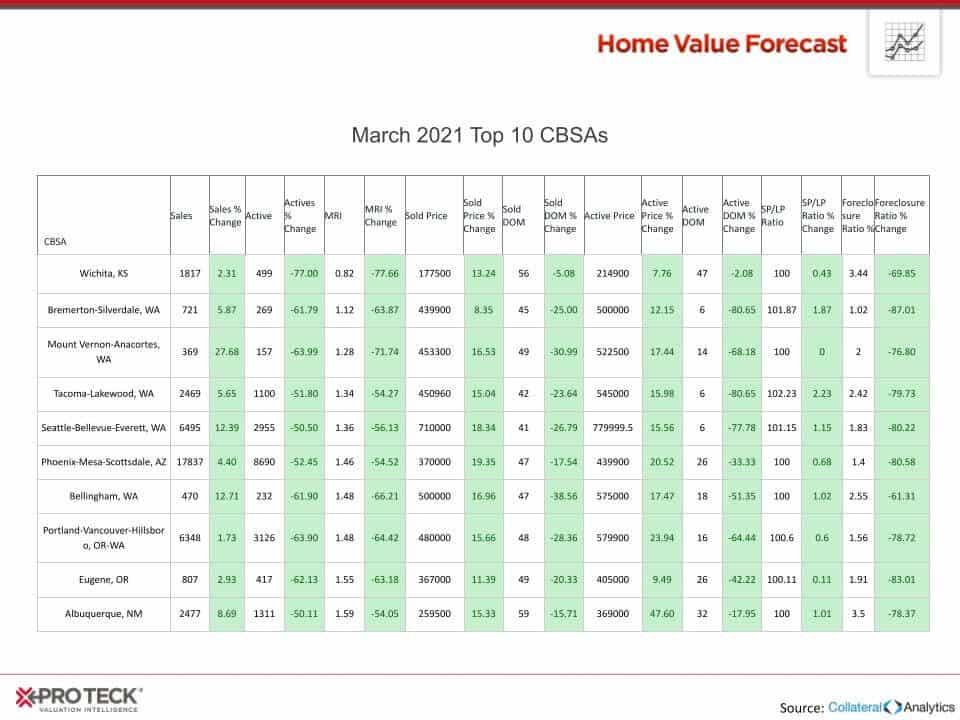
The tables below show the individual market indicators that are being used to rank the CBSAs, along with the most recent values and the percent changes. We have color-coded each of the indicators to help visualize whether it is moving in a positive (green) or negative (red) direction.
Top 10 CBSAs
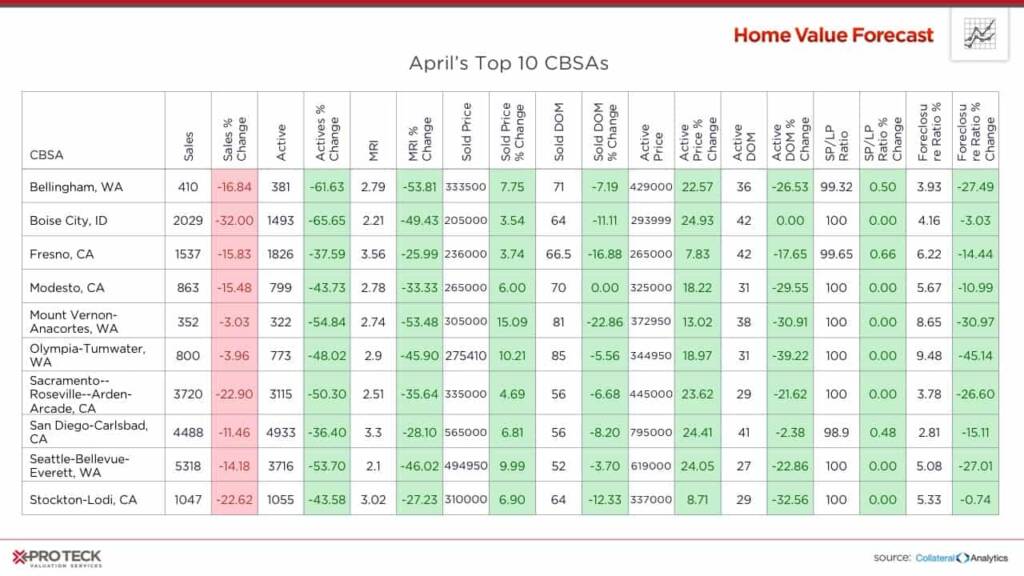
This month’s Top Ten goes west with five metros from California, four from Washington State and one from Idaho. Limited housing supply, increasing prices and decreasing market time is now the new normal in our top metros.
Bottom 10 CBSAs
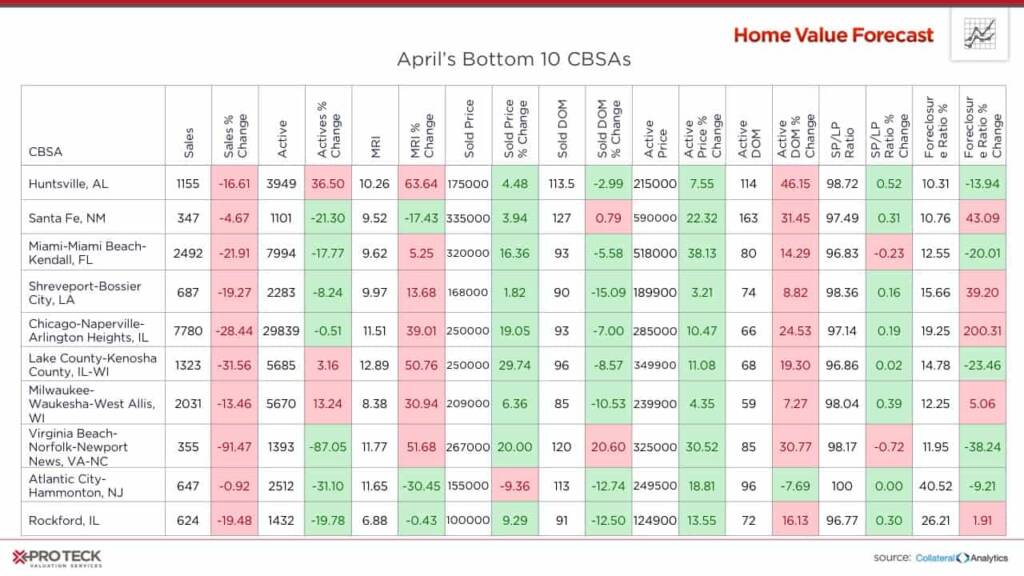
Our system ranks metros from best to worse based on an overall score. While at the bottom of our ranking this month, the majority of these metros are in much better shape than our bottom metros from years past, as can be seen by the number of “green” boxes above.
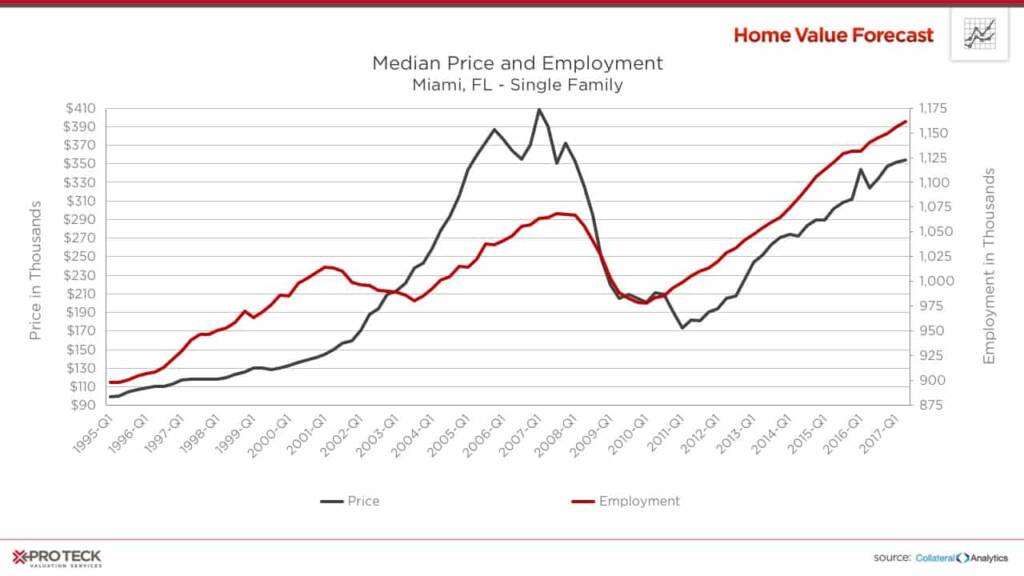
A noticeable trend we’re seeing is that employment is fueling recovery. For example, Miami is seeing a trend similar to San Jose, which hopefully will continue:
Unfortunately, Atlantic City, NJ is experiencing the other extreme:
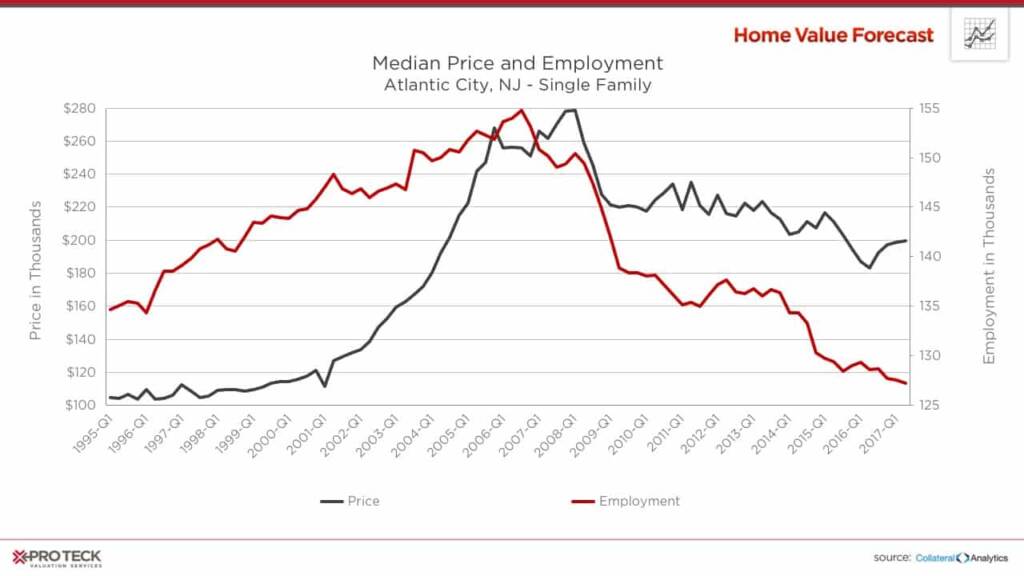
Recent developments, including the announced $375 million renovation/reopening of Trump Taj Mahal by Hard Rock casino and the construction of a satellite campus of Stockton University will bring jobs back to the city and hopefully reverse the trends of the last 10 years.
About Home Value Forecast
Home Value Forecast (HVF) is brought to you by SVI. HVF provides insight into the current and future state of the U.S. housing market, and delivers 14 market snapshot graphs from the top 30 CBSAs.
HVF is built using numerous housing and economic data sources. The top 750 CBSAs as well as data down to the ZIP code level for approximately 18,000 ZIPs are available with a corporate subscription to the service.
Also, SVI offers reporters the following:
- National, regional or metro level housing data
- Monthly updates and HVF insights articles
- By-request data for your story — custom data, heat maps and charts are available
- Expert commentary from Home Value Forecast Editorial Committee:
- Tom O’Grady, Chief Executive Officer, Pro Teck Valuation Services
- Michael Sklarz, PH.D., President, Collateral Analytics
- Jeff Dickstein, Chief Compliance Officer, Pro Teck Valuation Services