Home Value Forecast
Home Value Forecast Top 10, April 2021
Each month, Home Value Forecast uses a number of leading real estate market-based indicators to monitor single-family home market activity in the nation’s top 200+ metropolitan areas (CBSAs) and reports on the Top 10.
THE TOP 10
The Home Value Forecast Top 10 Hottest Housing Markets ranking system is purely objective and is based on directional trends over the past eight quarters. It’s not a listing of what markets are most expensive or most in need of inventory; it ranks market momentum at a specific point in time.
This month’s Top 10 is dominated by the west, with Washington, Arizona, Nevada and New Mexico representing seven of the Top 10 CBSAs:
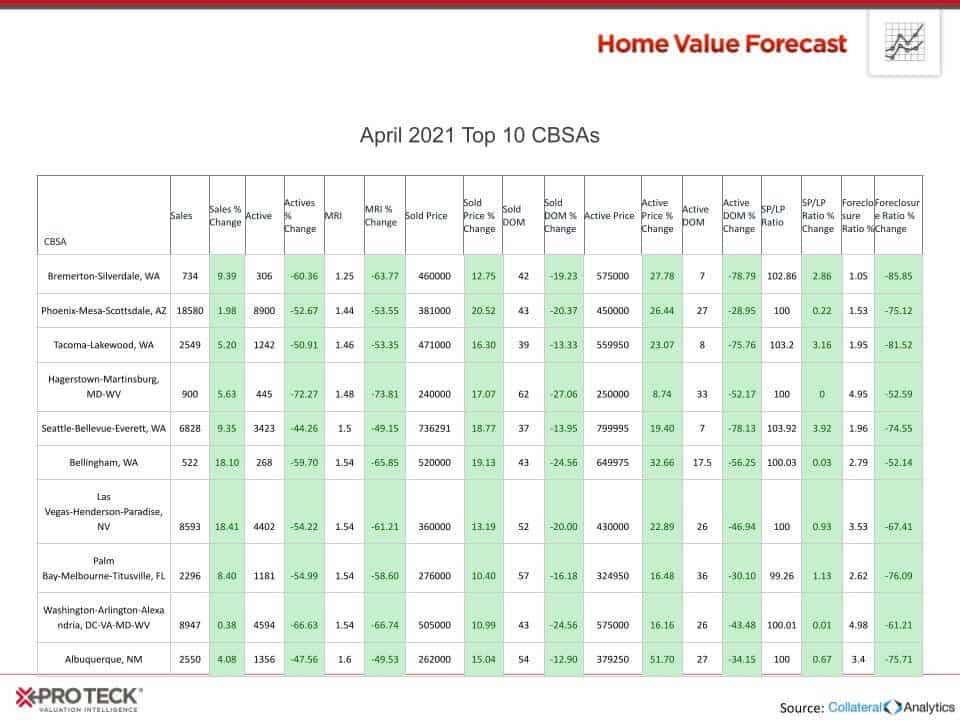
Lack of inventory is still driving a red-hot market, with our top 10 CBSAs all having less than 1.6 months of inventory.
In the current market, paying at or above listing price has become the norm, with nine of the top-ten metros above having a sales-price to list-price ratio of 100% or above. This is happening across the United States, as 183 of the 229 metros we track had a sales-price to list-price ratio of 100% or more.
ABOUT STEWART VALUATION INTELLIGENCE’S MONTHLY HOUSING MARKET REPORT
The Home Value Forecast uses a ranking system that is purely objective and is based on directional trends of market indicators. Each indicator is given a score based on whether the trend is positive, negative or neutral for that series. For example, a declining trend in active listings would be positive, as would an increasing trend in average price. A composite score for each CBSA is calculated by summing the directional scores of each of its indicators.
