Home Value Forecast
Rent to Value Ratio: The Economics of Rental Property
Lately there has been much news regarding the Government Sponsored Enterprises (GSEs) and other private REO-to-Rental programs. With housing prices nowhere near the highs of a few years ago, can investors make good returns renting these properties until the market recovers?
The simple answer is “yes,” but it’s not that easy to find a property that can provide enough rental income to cover all carrying costs while also being easy to convert into the owner occupied market once the housing market has recovered. In this month’s Lessons from the Data we will review some due diligence considerations that affect the risk in making such an investment.
Rent to Value Ratio (Rental Yield)
The ratio of rent to value can be a valuable guide and a requisite part of a thorough investigation of an investment opportunity. The thought behind this ratio (12 months of rent/home price), called “rental yield,” is that it is akin to the earnings-to-price ratio in the stock market: higher earnings, all else equal, are associated with more profitable investments and are less reliant upon future growth in the stock price to generate expected returns.
The same notion applies to the rental yield: higher rents make it less important for the property to appreciate in value in order to meet a certain expected return target set by the investor. However, rental yield alone, like the classic earnings-to-price ratio, is not a guarantee for a successful investment. It is necessary to look carefully “under the hood” at other considerations.
Rental Yield Drivers
Much research has been done to evaluate the drivers and the variability of rental yields among markets. Such research provides support for the role of rental yields in investment decisions, but also makes clear that there is no single rental yield that should guide all investment decisions. Here are some factors that lead to variations in the rental yields among markets.
1. Supply Elasticity Matters
Historically, we observe the highest current yields in elastic markets where it is easy to add new housing supply. Because it is easy to add new supply, any significant real increases in prices result in more units being added to the market. Rents will tend to rise while prices stay flat in these elastic markets as investors turn to rents in order to make a return on investment, while many would-be home buyers rent because a non-appreciating home purchase is a less attractive investment and/or they can’t obtain the financing with today’s tighter underwriting guidelines.
We see variations in gross rental yields at the neighborhood level maps generated by SVI’s Home Value Forecast. In supply constrained markets like New York (Figure 1) we see rather low yields.
Figure 1: Single Family 2011 Gross Rental Yields by Neighborhood in New York
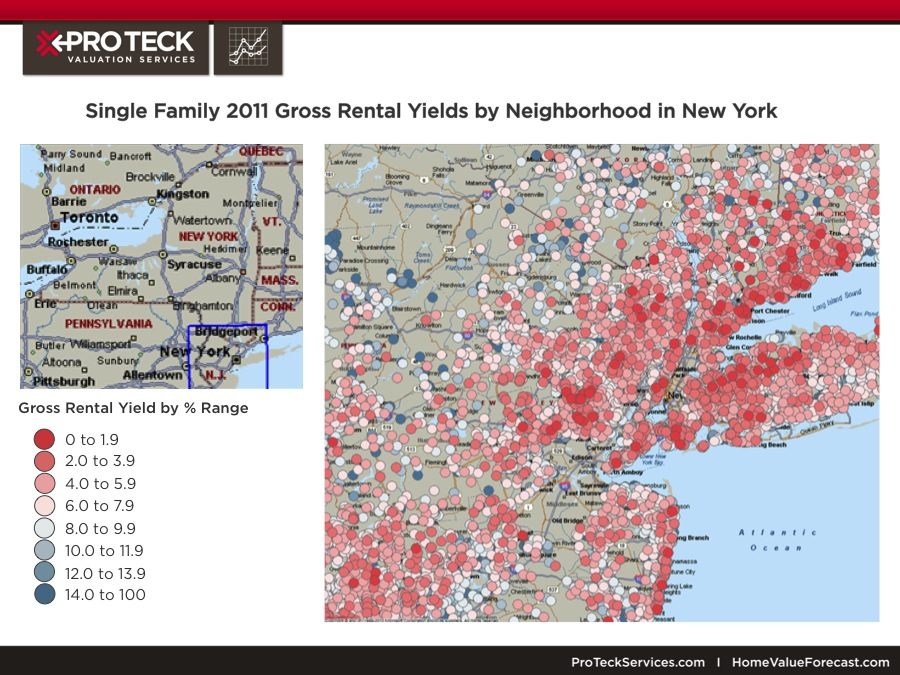
The darkest red dots represent yields under 2 percent, while the pink dots range from 2 percent to 5.9 percent, the lightest pink dots range from 6 percent to 7.9 percent and the various shades of darker blue reach to 14 percent and above. It is apparent that in these markets the current gross yields are rather low, and it would be difficult to carry such properties as investments without infusing cash during the holding period.
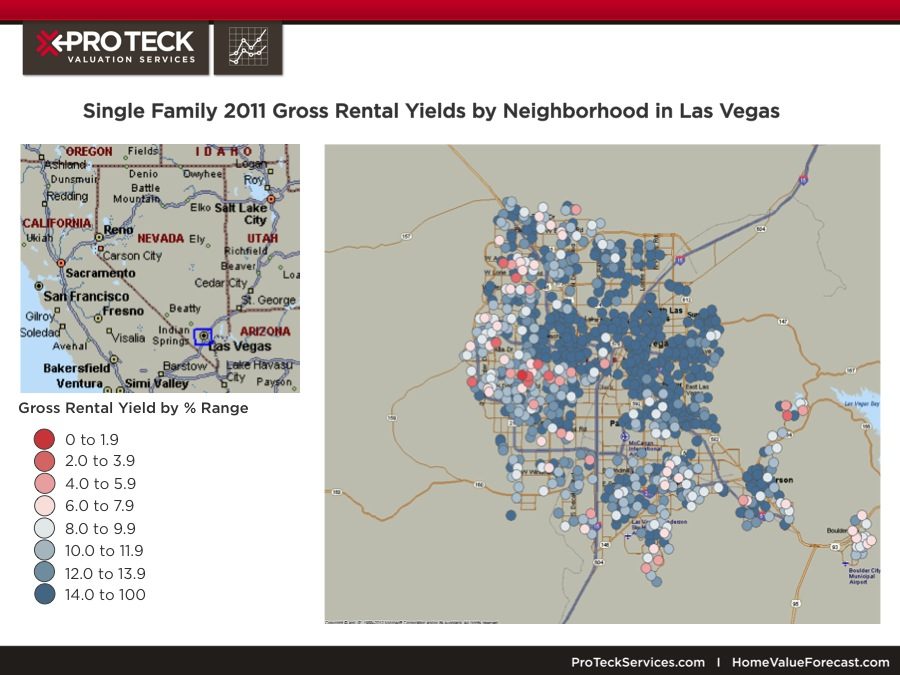
At the other extreme, we have markets like Las Vegas (Figure 2), where we see many dark blue dots and gross yields close to or above 14 percent. Granted, in such markets we also must consider the risk of having a vacancy and do some research on the chances of finding tenants.
Figure 2: Single Family 2011 Gross Rental Yields by Neighborhood in Las Vegas
2. Subprime Effects Linger
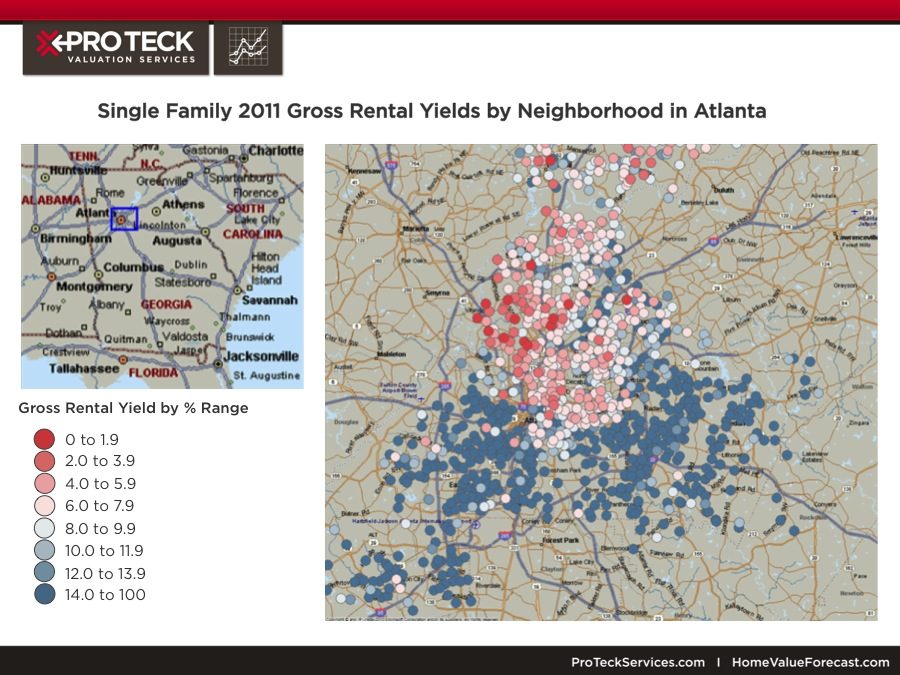
The higher current yields are also correlated with the degree of subprime lending and high loan to value (LTV) mortgages as these markets continue to be impacted by a high degree of distress sales holding prices down. We can see this in markets like Atlanta (Figure 3), where we observe neighborhoods within the same metropolitan area where the rental yields are quite high (generally southern Atlanta, where prices have been held down by higher ratio of distressed sales) and other neighborhoods where the yields are quite low, and where distressed sales are not as common.
Figure 3: Single Family 2011 Gross Rental Yields by Neighborhood in Atlanta
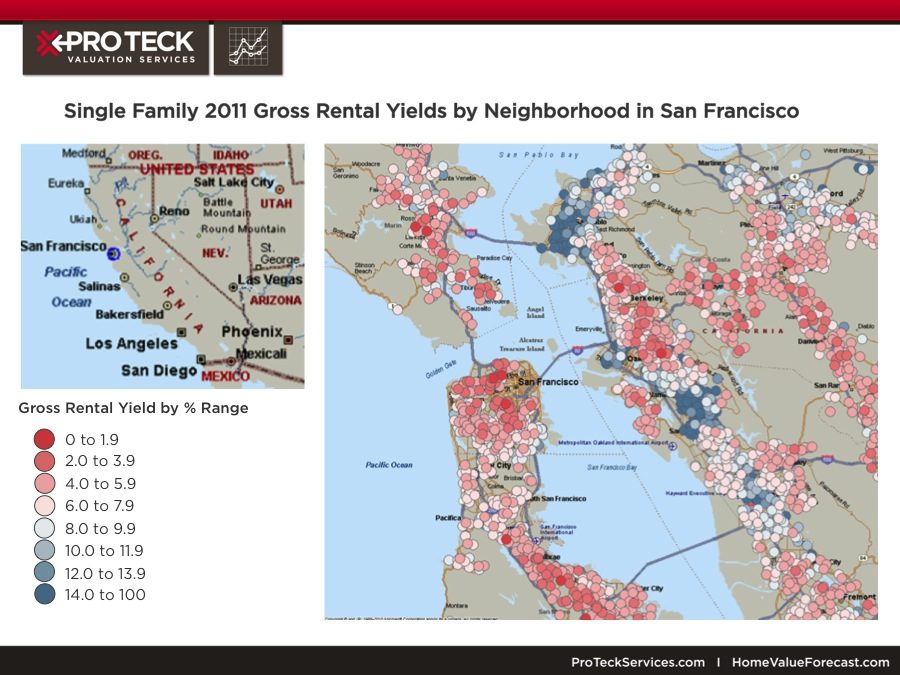
We also see this mix of low and high yields in the San Francisco metro (Figure 4) where markets like Richmond and San Pablo remain distressed with much higher rental yields compared to San Francisco.
Figure 4: Single Family 2011 Gross Rental Yields by Neighborhood in San Francisco
3. Risks Are Correlated with Current Yields
The dilemma for investors who wish to take advantage of the new REO sales coming on the market is that the least distressed and most supply constrained markets (which are those where prices are most stable and likely to increase over the next few years) are the most difficult to carry The reverse is true in markets like Las Vegas, where yields are much higher but there is uncertainty when the excess supply will expire. There is also uncertainty how many years will pass before prices will increase in such markets.
Eventually excess supply will dissipate, but by then mortgage rates may be double, holding prices down. So even if there is confidence that the supply will normalize, as it has in markets like Phoenix, there is no guarantee of price increases.
An investor can look to market data and forecasts to help determine markets that have both strong current fundamentals and strong longer term drivers that indicate the home’s value is likely to appreciate, providing the opportunity to sell the investment for a profit in the future. Some of the current fundamentals an investor may look at would be vacancy rates, rental rates, months of inventory on the market, price trends and amount of distressed sales. Longer term drivers of future value appreciation are broader economic drivers like mortgage rates, household income and employment growth. Forecasting models that incorporate such longer term drivers can be used to estimate future appreciation.
Calculating out Carrying Costs
We can calculate how much rent must be collected in order to carry an investment rental home using a housing cost factor (HCF). The HCF expresses the cost of carrying a home as a percent of the original price that needs to be paid annually in order to cover home expenses. It does not include the required return on equity and so is very sensitive to leverage (the amount borrowed as a percent of the original price). Let’s use the following assumptions to demonstrate:
- Loan rate at 4 percent with 50 percent loan to value ratio (2 percent of the home price net)
- Property taxes at 1.0 percent of home price
- Property insurance at .75 percent of the home price
- Utilities to be paid by tenant
- Maintenance at 1.25 percent of home price
The result of adding these together is exactly 5 percent of the home price: r/v = .02 + .01 + .0075 + .0125 = .05. If you assume no vacancy, then no adjustment is needed, but if you assume 10 percent vacancy, the HCF is equal to 5 percent divided by the average occupancy rate, 90 percent, or 5.556 percent. We must also add something for management which tends to run 10 percent to 20 percent as a percentage of the rent collected for single family homes. If we use 10 percent then we need to hit 5.556 percent again divided by 90 percent resulting in 6.2 percent as the average required current cash yield necessary in order to carry the unit without any on-going subsidy.
One question is how many distressed REO sales are out there where the rent is going to average 6.2 percent or more of the price of the home? Looking at the maps in this article, any of the submarkets with light pink to blue dots meet this criterion and are candidates for acquisition when one must hold for three years or longer.
Such is not the case in those markets dominated by red or darker pink dots because the rental incomes in these areas make it difficult to “carry” these homes, even with 50 percent down. Even 100 percent down REO investments need around a 4 percent yield per year in order to cover property taxes, insurance, maintenance and management expenses and many markets do not provide yields that high. The conclusion is that holding a property for three years or more in a market where the rent may not even cover the carrying cost is not appealing. These low yield markets remain most appealing to flippers who will come in, repair the homes and put them back on the owner occupied market as soon as possible.
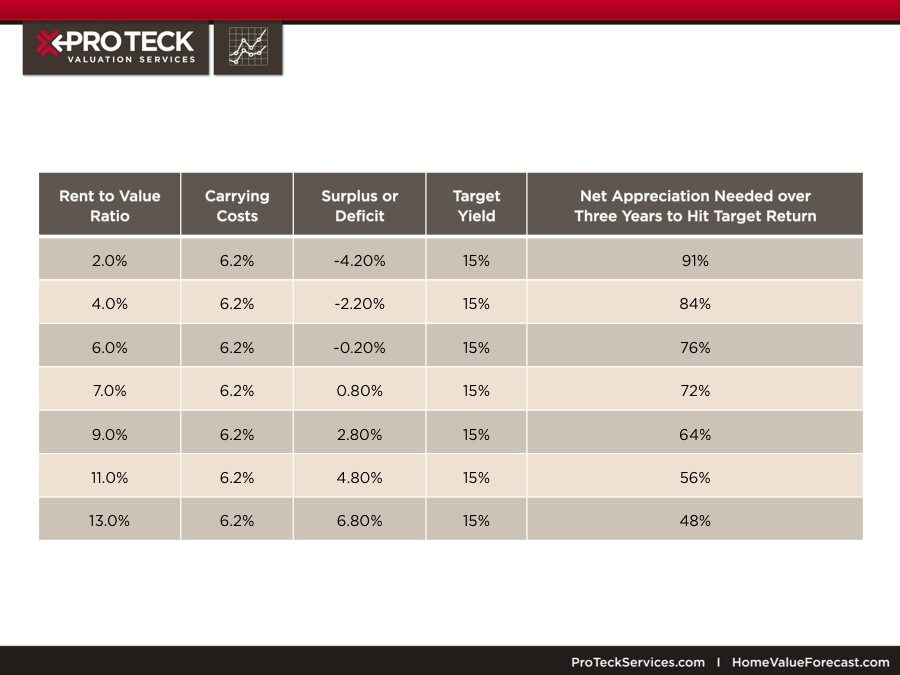
In the table below we calculate the net appreciation required in order to hit a target internal rate of return (annualized yield) over three years, given the going-in rent to value ratio and carrying costs. The difference between these two is the deficit that must be met by appreciation in the value of the property in order to meet the target internal rate of return.
It is obvious that much less appreciation is needed to hit the same target return when higher going-in yields are possible, although one might argue that in such markets there is much more risk, requiring premium yields.
Note that an appreciation rate of ~80 percent over three years is the same as buying a REO property at approximately 45 percent less than the eventual sales price. This is not unusual on REO sales purchased from 2008 through 2010 (discounts have narrowed since due to increased competition for properties).
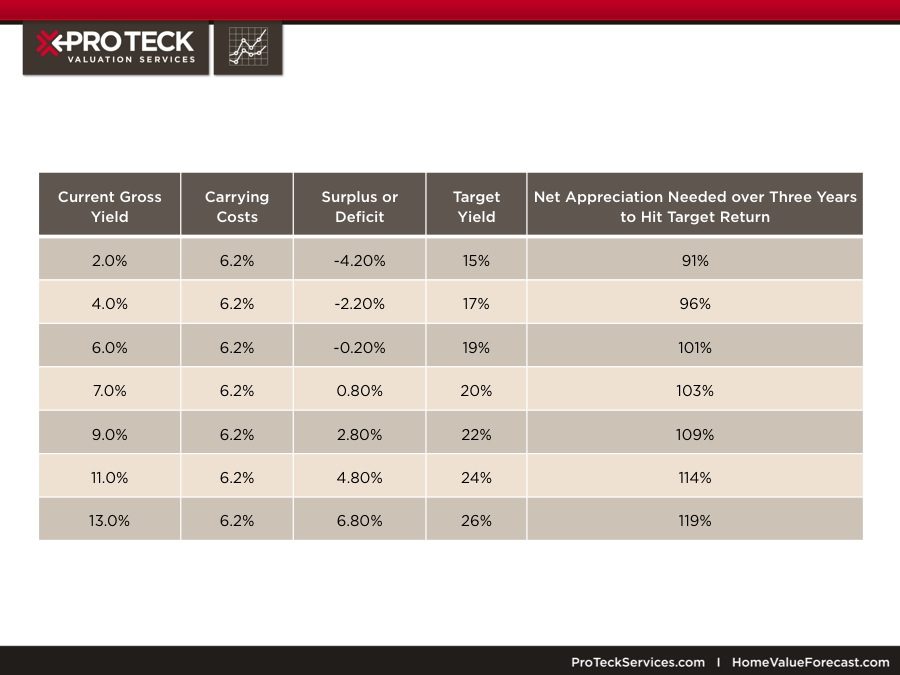
Below we vary the calculations to show the effects of requiring higher yields in those markets where the current yields are higher, but the risks are also higher in several ways.
A key source of such risk is the size and ultimate disposition of the inventory of distressed real estate being held by banks. For example, the rapid disposition of this distressed inventory may dampen prices and increase vacancy rates.
One way to capture such risk is to increase the required yield a percent in line with the increased going-in yield. The result is that we need slightly more net appreciation, as we step up the current yields, which is less likely in these less supply constrained markets.
Conclusions
The more conservative investors who buy REOs from the GSEs (Fannie Mae and Freddie Mac) will likely seek out acquisitions in those markets where the current (gross) yields are significantly above 6 percent and where current vacancies are not excessive. Such properties are not without risks but are easier to carry.
Markets where the current yields are very low are better matched with flippers who will want to turn them in as little time as possible, selling them back into the owner-occupied market without ever renting them out. But these lower current yield properties do not accommodate significant financing leverage without periodic cash flow infusions and if interest rates go up, the new buyer demand from owner occupiers will soften. One must also keep in mind that eager buyers often do not qualify in today’s underwriting environment so that alone restricts the depth of demand.
The bias of REO investors towards higher yield properties is, in fact where we see the most demand for REOs. These investors will need to carry the properties for at least a few years or longer and be patient in off-loading inventory at paces that the market can absorb without significantly affecting current prices. Those markets where the yields are not high enough to carry nor low enough to be good flipper candidates may flounder for a bit longer as they fall through the cracks of market appetites.
James R. Follain, Ph.D.
James R. Follain LLC and Advisor to FI Consulting
Norm Miller, PhD
Professor, Burnham-Moores Center for Real Estate
University of San Diego
Michael Sklarz, Ph.D.
President
Collateral Analytics
About Home Value Forecast
Home Value Forecast was created from a strategic partnership between SVI and Collateral Analytics. HVF provides insight into the current and future state of the U.S. housing market, and delivers 14 market snapshot graphs from the top 30 CBSAs. Each month, HomeValueForecast.com delivers a monthly briefing along with “Lessons from the Data,” an in-depth article based on trends unearthed in the data.
HVF is built using numerous data sources including public records, local market MLS and general economic data. The top 750 CBSAs as well as data down to the ZIP code level for approximately 18,000 ZIPs are available with a corporate subscription to the service.