Home Value Forecast
No, there is no housing bubble, even in the nation’s hottest markets
Federal Reserve Chair Janet Yellen said recently that the U.S. economy will need Fed stimulus, including low interest rates, for the foreseeable future. Yellen’s statements alleviated fears that interest rates would begin to rise in mid-2015.
“This extraordinary commitment is still needed and will be for some time, and I believe that view is widely shared by my fellow policy makers,” Yellen said Monday, March 31st at a conference in Chicago. “The scars from the Great Recession remain, and reaching our goals will take time.”
We at Home Value Forecast bring this up because there have been reports in the media with concerns about a “second housing bubble” looming on the horizon. Recent opinions in the press have cited California markets as examples of overheated markets that are primed for a negative turn. Looking at our Top 10 for this month, the majority are California communities. We can see how people could be concerned, and if Yellen is successful containing interest rates it will only help support further home price appreciation.
In late July 2013 we wrote about this phenomenon in an update titled Current Rise in Home Prices is not Another National “Housing Bubble”. Click the link to read how Home Value Forecast, using Collateral Analytics “Bubble Indicator” showed that many other factors in addition to price need to be present in order for a “bubble” to occur. We updated our graph for the Los Angeles market with 8 more months of data:
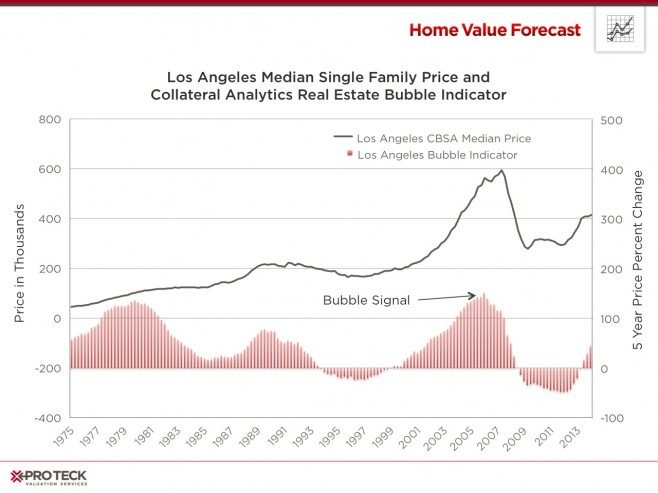
Collateral Analytics previously developed a bubble indicator for the real estate market, determining that throughout history real estate crashes have always followed a five year period of 150% or greater total appreciation. The Los Angeles CBSA, leading this month’s HVF Top 10, has appreciated 48% over the past five years. It’s an impressive run, but far from bubble territory.
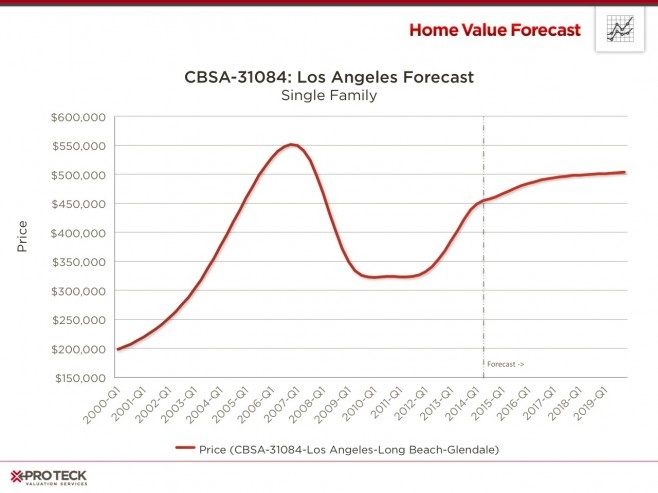
The forecast below for the Los Angeles CBSA shows the current median home price of $449,300 is still well below the peak of $551,500 in Q4 2006. Collateral Analytics five year forecast is based in part on 30-year mortgage interest rates rising slowly and reaching 6% in late 2019. Over this period home prices are predicted to steadily appreciate, reaching $503,900 by Q4 2019, but still short of their 2006 peak.
The US housing market is certainly in recovery but still needs support. The experts at the Federal Reserve, understanding that the broader economic recovery remains fragile, appear to feel our economy and housing market will continue to need Fed stimulus so that low interest rates will keep these recoveries on track. This will certainly keep home appreciation moving in the right direction but far short from leading us into another housing bubble, even in the hottest markets.
CBSA Winners and Losers
Each month, Home Value Forecast uses a number of leading real estate market-based indicators to rank the single family home markets in the top 200 CBSAs to highlight the strongest and weakest metros.
The ranking system is purely objective and is based on directional trends. Each indicator is given a score based on whether the trend is positive, negative or neutral for that series. For example, a declining trend in active listings would be positive, as will be an increasing trend in average price. A composite score for each CBSA is calculated by summing the directional scores of each of its indicators. From the universe of the top 200 CBSAs, we highlight each month the CBSAs which have the highest and lowest composite scores.
The tables below show the individual market indicators that are being used to rank the CBSAs along with the most recent values and the percent changes. We have color coded each of the indicators to help visualize whether it is moving in a positive (green) or negative (red) direction.
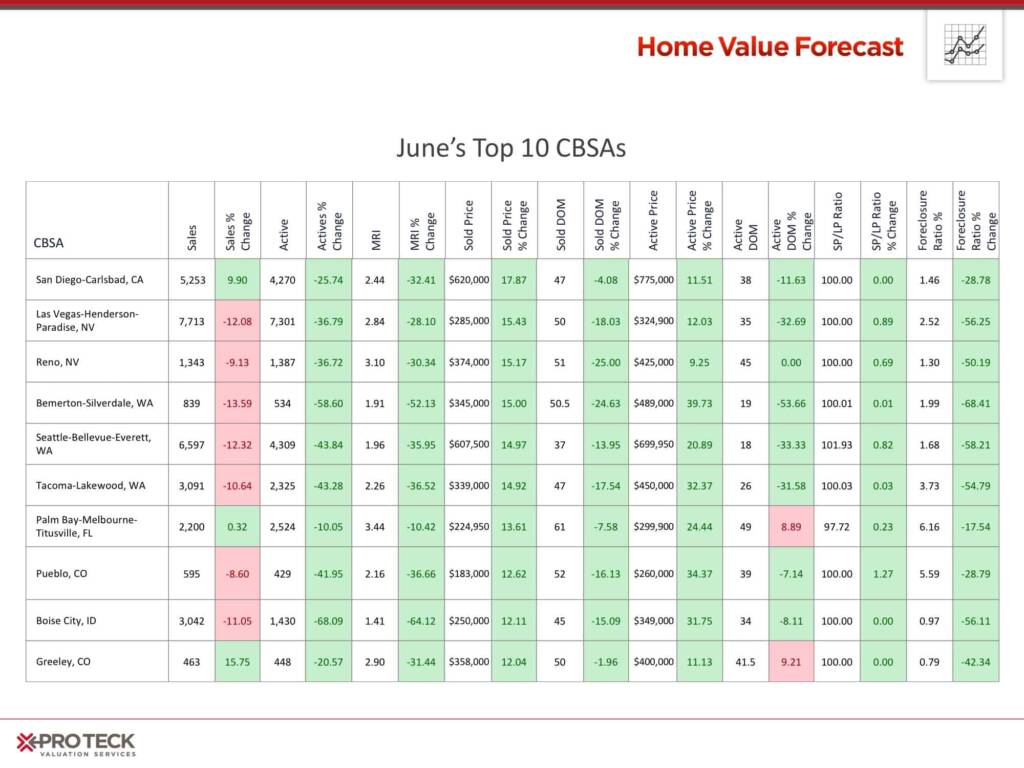
Top 10 CBSAs
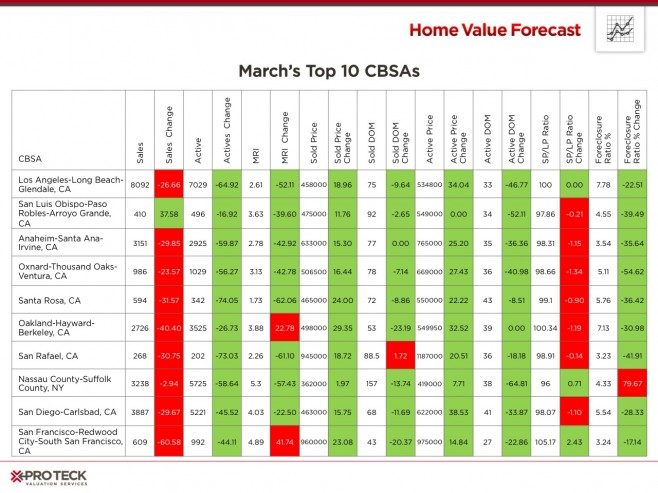
California is leading the charge, with nine of our top 10 metros from the state. Inventory seems to be having an impact, with Months of Remaining Inventory as low as 1.73.
Bottom 10 CBSAs
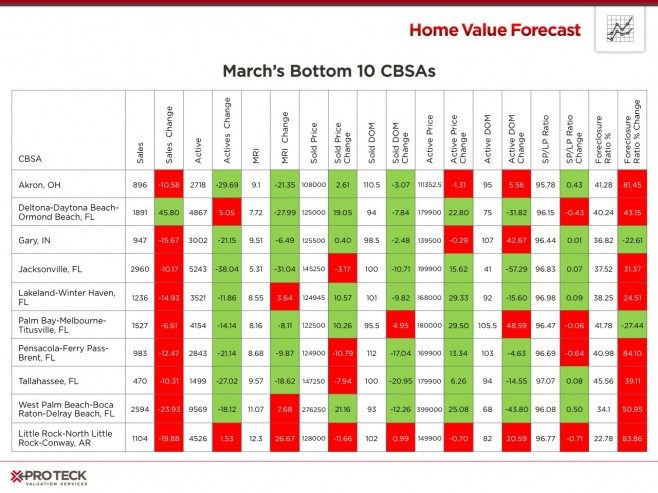
It’s hard to sustain a market turnaround with high numbers of foreclosure sales. All our entrants in the bottom 10 have high foreclosure ratios and Months of Remaining Inventory (MRI). The good news is that there are many positive trends (green boxes) as the housing recovery has spread.
Also of note is all of the CBSAs in our bottom 10 except for Little Rock, AR are from “judicial states” where the foreclosure process is drawn out over a longer time. To learn more, please read our earlier post, The Timeline of a Turnaround.