Home Value Forecast
HVF Monthly Housing Report: Las Vegas Housing Market on a Roll
Each month, HVF’s Housing Market Report uses a number of leading real estate market-based indicators to report on activity in the single-family home markets in the top 200 metropolitan areas (CBSAs) in the U.S.
In this month’s Housing Market Report, we celebrate the success taking place in the “Entertainment Capital of the World.” Not only is Las Vegas fired up for its hockey team, the Golden Knights, but the housing market happens to be one of the hottest in the nation right now.
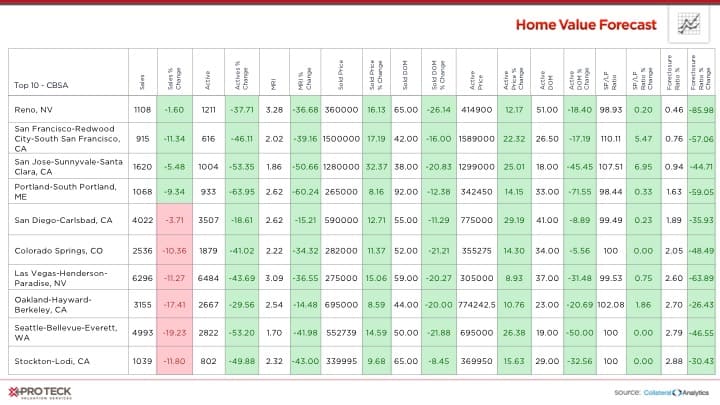
As one of the CBSAs featured in this month’s list of Top Ten hottest housing markets, the Las Vegas-Henderson-Paradise, NV, market is about as healthy as they come. Prices are up over 15% from the same time last year and Sold Days on Market is down 18%, leaving under three Months of Remaining Inventory.
For this month’s Top Ten, all of the CBSAs featured have experienced more than 12% increase in Sold Price for the year:
But while things are surely looking bright in the Vegas housing market these days, surging home prices are leading some to question whether the market will become overvalued — making it a major gamble for future homebuyers.
Employment and home value are highly correlated – when they get out of sync there will always be a correction. Between 2003 and 2007, prices in Las Vegas outpaced what was happening in employment, the corresponding correction was quick and drastic.
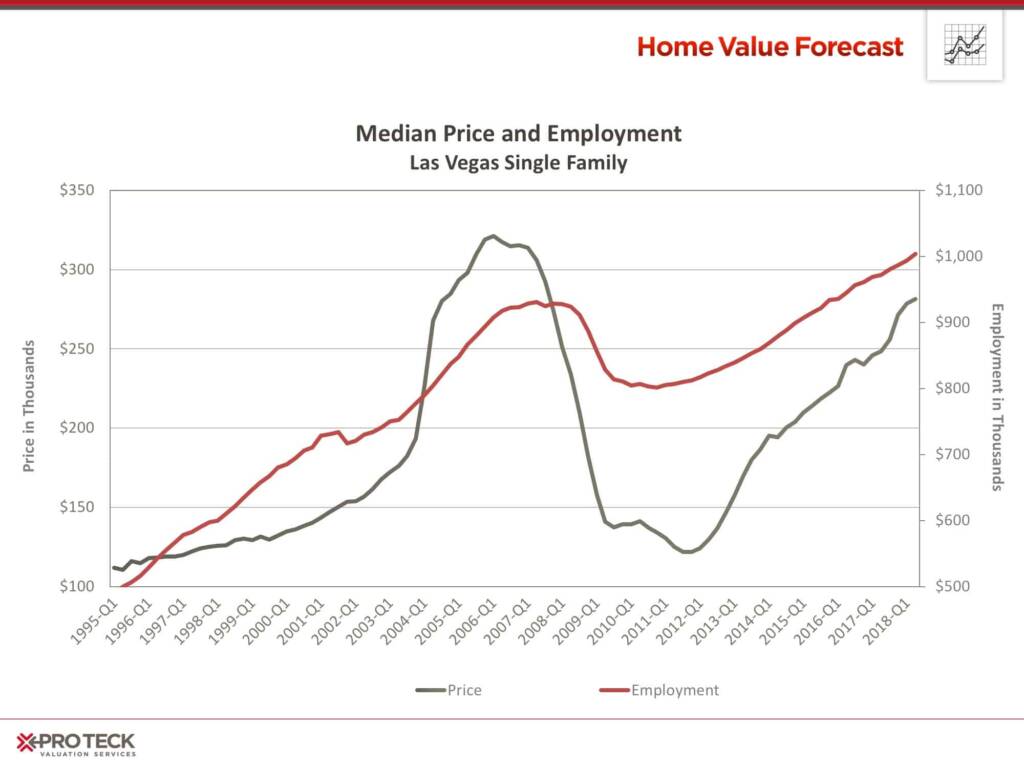
Today, prices and employment are tracking closer to normal as the area looks to exceed pre-crash highs.
Interested in learning more about the top metros featured in this month’s market report? Contact SVI for more in-depth information on each CBSA listed in this month’s report.
About SVI’s Monthly Housing Market Report
The Home Value Forecast uses a ranking system that is purely objective and is based on directional trends of nine market indicators. Each indicator is given a score based on whether the trend is positive, negative or neutral for that series. For example, a declining trend in active listings would be positive, as would an increasing trend in average price. A composite score for each CBSA is calculated by summing the directional scores of each of its indicators. From the universe of the top 200 CBSAs, each month we highlight topics and trends in the real estate market.