Welcome to the first monthly Home Value Forecast (HVF), where Stewart Valuation Services and Collateral Analytics will bring you a unique perspective on the U.S. housing market. Our goal with the forecast is to highlight the fact that all real estate is local. Regional trends are great for understanding the big picture, but one needs to understand micro market drivers to make fully informed decisions about specific real estate assets.
As with other forecasts we will comment on U.S. trends and predict future movement. We then will look at CBSA level data and individual ZIPs within CBSAs that are “outliers” – exhibiting significant differences from overall CBSA conditions. Our unique micro market data provides timely and comprehensive information on sales, listings and off-market activity for 90% of the U.S. housing stock. This data has enabled us to provide home price indexing, forecasting and market analytics from a national, regional and neighborhood level perspective.
At Home Value Forecast you will find 14 market indicator graphs for the top 30 CBSAs. While there please sign up for our newsletter where we will send you our monthly market update and “Lessons from the Data” story. You can also request more information on our more granular micro market data.
Home Value Forecast Methodology
A CBSA level real estate market ranking system has been developed for the Home Value Forecast website. Data used in HVF include local market MLS, public real estate and other economic sources.
The rankings are run for the single family home markets in the top 200 CBSAs on a monthly basis to highlight the best and worst metros with regard to a number of leading real estate market based indicators. These include:
- Number of Active Listings
- Average Listing Price
- Number of Sales
- Average Active Market Time
- Average Sold Price
- Number of Foreclosure Sales
- Number of New Listings
The ranking system is purely objective and is based on the directional trend of each of these series using actual data over the past 8 quarters. The trends are then defined as being increasing, stable, or decreasing. Each indicator is given a score based on whether the trend is positive, negative, or neutral for that series. For example, a declining trend in active listings would be positive as will be an increasing trend in average price. A composite score for each CBSA is calculated by summing the directional scores of each of its indicators. From the universe of the top 200 CBSAs, we highlight each month the CBSAs which have the highest and lowest composite scores.
U.S. Real Estate Trends
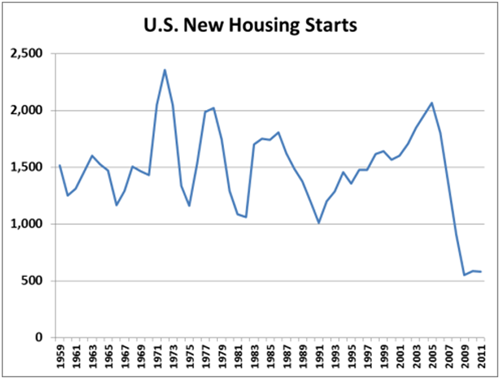
The nationwide real estate market has been receiving its fair share of bad news in the past several years as home prices have declined significantly in many areas leading to very high levels of distressed sales and inventory. One of the less followed casualties of this very difficult environment has been new home construction which, as seen in the chart above, is currently running at the lowest levels seen in the past 50 years. The most recent seasonally adjusted total is down 5.8% from a year ago but little changed from its 2009 values. This most likely suggests that new home construction has likely found a bottom in the vicinity of its current very depressed levels.
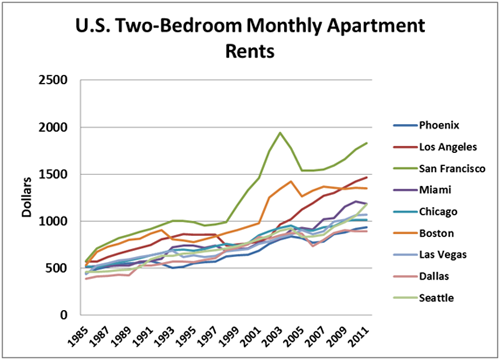
This has also led to a tightening rental market in many parts of the country. The chart below shows the median two-bedroom apartment rents for a number of the major metros based upon data from HUD. As seen, these trends have been very different from the home price trends in these markets. In fact, the combination of rising rents and declining home prices has led to the rental yields for both single family homes and condominiums being close to record levels in many areas. This is one of the important reasons why astute investors are now taking a serious look at purchasing distressed properties in a number of the hardest hit real estate markets.
CBSA Winners and Losers
The top ranked CBSAs exhibit a fairly consistent theme which is that in nearly all cases prices have declined significantly (40 to 50 percent) from their peak 2005-2006 levels and have been moving sideways or slightly downwards for more than two years. While the first thought might be to assume that these are very depressed markets with little prospect for improvement, the positive trends in our various indicators suggest that buyers are taking advantage of the depressed prices and the corresponding excellent values.
Conversely, in a number of the lowest ranked CBSAs, prices have held up quite well since the peak in the market. However, the negative trends in the various market indicators suggest that prices may have further to fall before these markets regain their equilibrium.
The top CBSAs in the current month based upon our ranking system:
- Cape Coral – Fort Myers, FL
- North Port – Bradenton – Sarasota, FL
- Punta Gorda, FL
- Lakeland, FL
- Orlando – Kissimmee – Sanford, FL
- Syracuse, NY
- Tallahassee, FL
- Bakersfield – Delano, CA
- Bend, OR
- Bethesda – Rockville – Frederick, MD
The bottom 10 CBSAs in the current months:
- Portland – Vancouver – Hillsboro, OR-WA
- Racine, WI
- Reno – Sparks, NV
- Spokane, WA
- Toledo, OH
- Tucson, AZ
- Vallejo – Fairfield, CA
- Hickory – Lenoir – Morganton, NC
- Richmond, VA
- Olympia, WA
Outliers
All real estate is local, and what’s happening at the ZIP level is not always consistent with CBSA trends. In this regard, our analytic tool enables users to track real estate markets around the U.S. by county, city, ZIP code, or neighborhood as well as by property type, transaction type, price range and property characteristics.
For this month we will look at Bakersfield, CA.
The following graph charts price trends of the Bakersfield CBSA versus an individual ZIP code, 93314, within the CBSA. As you can see, both had similar prices up until the peak in 2006. After then, ZIP code 93314 has lost 45.5% of its home value versus 56.8% for the overall metro.
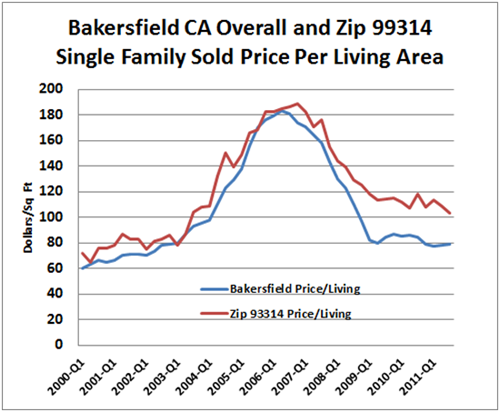
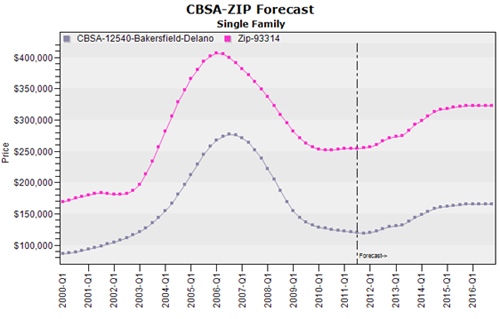
With regard to relative price performance, we have found that the hardest hit markets were those where the buyers during the market peak period were the most heavily leveraged – i.e. had very high loan-to-value ratios (LTVs). Our data shows that for all of Bakersfield, the average LTV has been well over 90 percent while that for Zip 93314 has been about 85%.
About SVI’s Monthly Housing Market Report
The Home Value Forecast uses a ranking system that is purely objective and is based on directional trends of nine market indicators. Each indicator is given a score based on whether the trend is positive, negative or neutral for that series. For example, a declining trend in active listings would be positive, as would an increasing trend in average price. A composite score for each CBSA is calculated by summing the directional scores of each of its indicators. From the universe of the top 200 CBSAs, each month we highlight topics and trends in the real estate market.
