Home Value Forecast
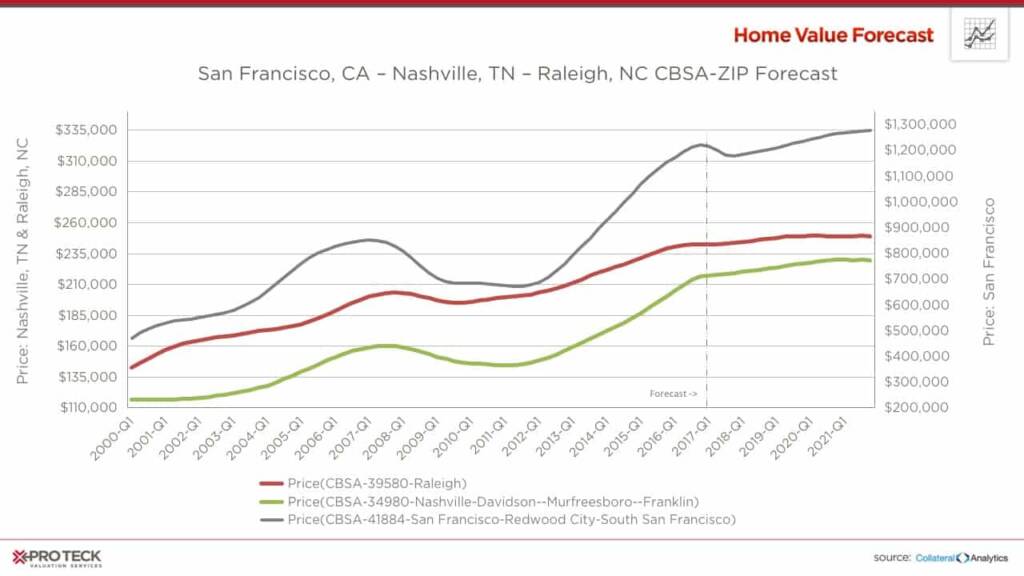
Home Value Forecast: Low Inventory, High Demand Driving Prices Up, Up & Away
Each month, Home Value Forecast uses a number of leading real estate market-based indicators to monitor single-family home market activity in the nation’s top 200+ metropolitan areas (CBSAs) and report on the Top 10.
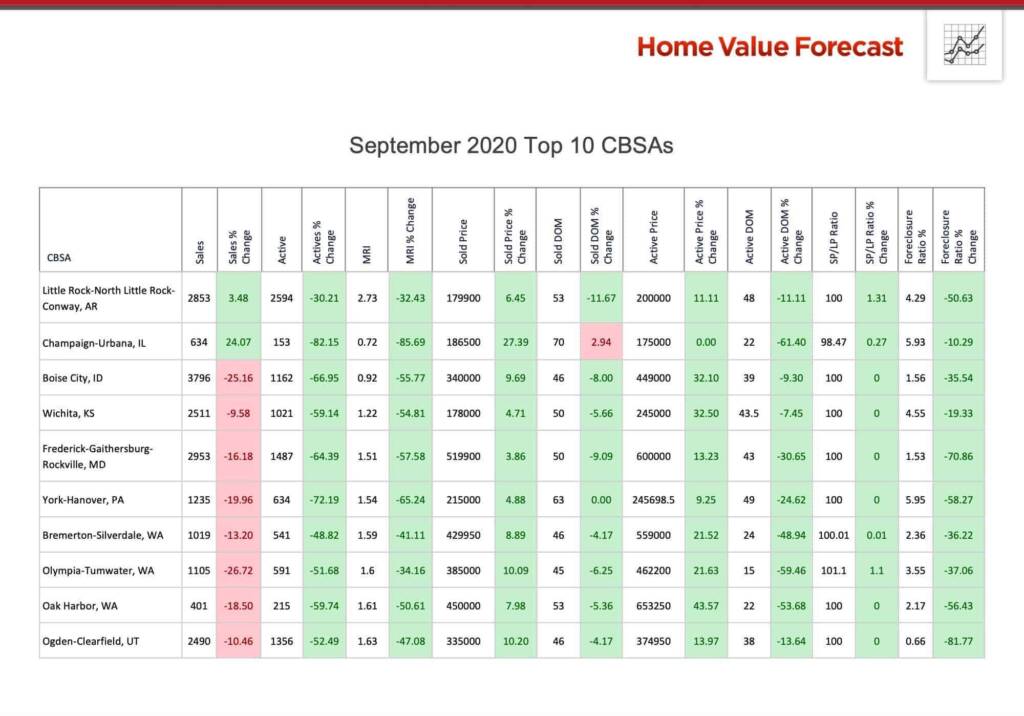
THE TOP 10
The Home Value Forecast Top 10 Hottest Housing Markets ranking system is purely objective and is based on directional trends over the past eight quarters. It’s not a listing of what markets are most expensive or most in need of inventory; it ranks market momentum at a specific point in time.
This month’s Top 10 is regionally diverse, except for the three metros from Washington state:
Last month we discussed how a lack of housing supply has led to fierce bidding wars and low months of remaining inventory (MRI). This month is no different — but now we are seeing the results of this depleted inventory phenomenon in the sale price to list price ratio.
The sale price to list price ratio is simply the sales price divided by the last list price. If it’s above 100%, the home sold for more than the list price, if it’s less than 100%, the home sold for less than the list.
Homes selling over list price is not uncommon. But having entire CBSAs average sale price to list price ratios of 100%+ was, but isn’t anymore. At this time in 2014, only 14 of the 229 CBSAs we track, or 6.11%, had a sales to list price ratio of 100% or more. Of the 14, 11 of the metros were in California, making it more of a geographic phenomenon.
This month, 131 CBSAs, or 57.21% of the metros we track from all around the country are averaging selling prices at or above asking.
| Year | # of CBSAs averaging sale price to list price ratios at or above 100% |
| 2014 | 14 |
| 2017 | 47 |
| 2018 | 88 |
| 2019 | 98 |
| 2020 | 131 |
There’s not enough housing supply, and there won’t be enough for some time.
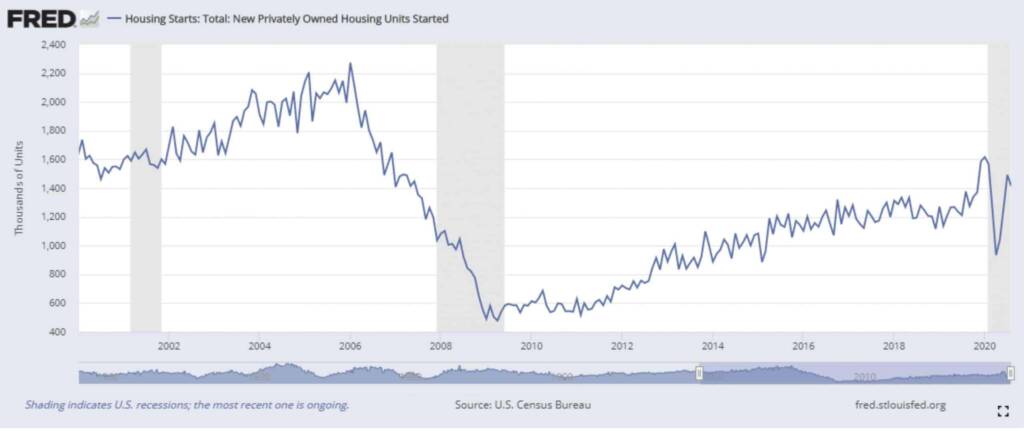
Home starts are nowhere near pre-2006 levels. They’ve been on an upward trajectory since bottoming out from 2009 to 2012, but preliminary 2020 numbers show the impact of COVID on building across the country. Hopefully housing starts rebound soon to help meet today’s demand.
ABOUT SVI’S MONTHLY HOUSING MARKET REPORT
The Home Value Forecast uses a ranking system that is purely objective and is based on directional trends of market indicators. Each indicator is given a score based on whether the trend is positive, negative or neutral for that series. For example, a declining trend in active listings would be positive, as would an increasing trend in average price. A composite score for each CBSA is calculated by summing the directional scores of each of its indicators. From the universe of the top 200 CBSAs, each month we highlight topics and trends in the real estate market.