Home Value Forecast
Home Value Forecast: Will Increases in Mortgage Interest Rates Impact Home Prices?
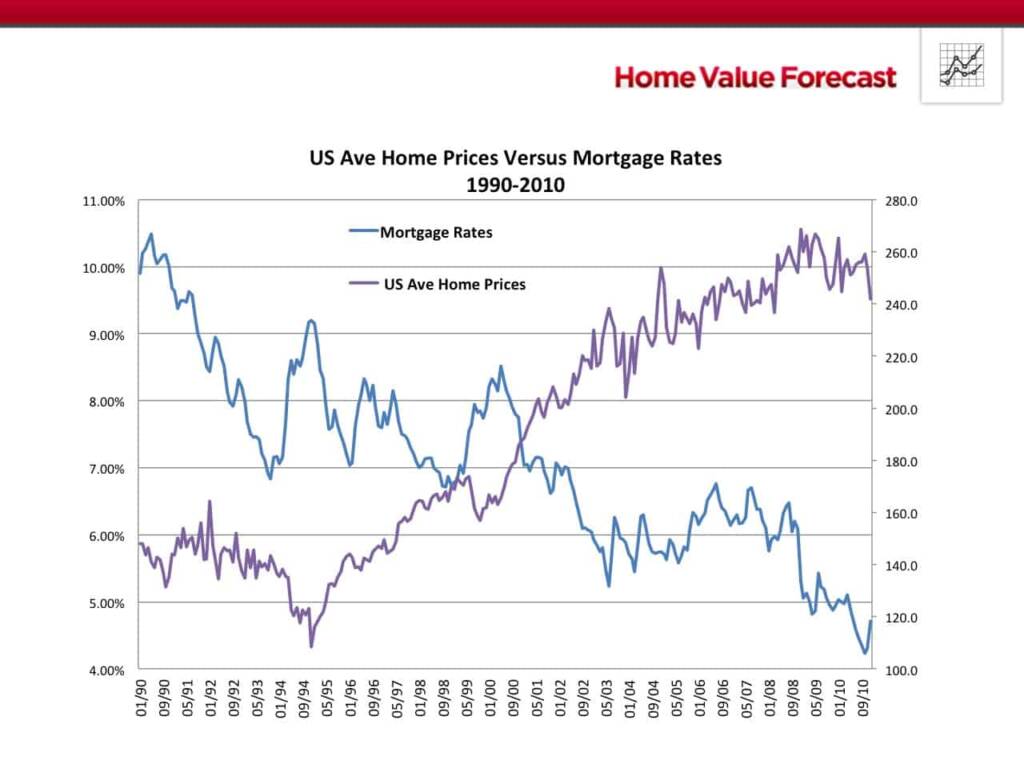
Earlier this month, the Federal Reserve increased the nation’s interest rate by 0.25 percentage points — only the third rate increase since the housing crisis. Rates are forecasted to go up over the next five years from today’s 4% to 5.25%, still historically low when compared to highs in the teens during the late 1980s.
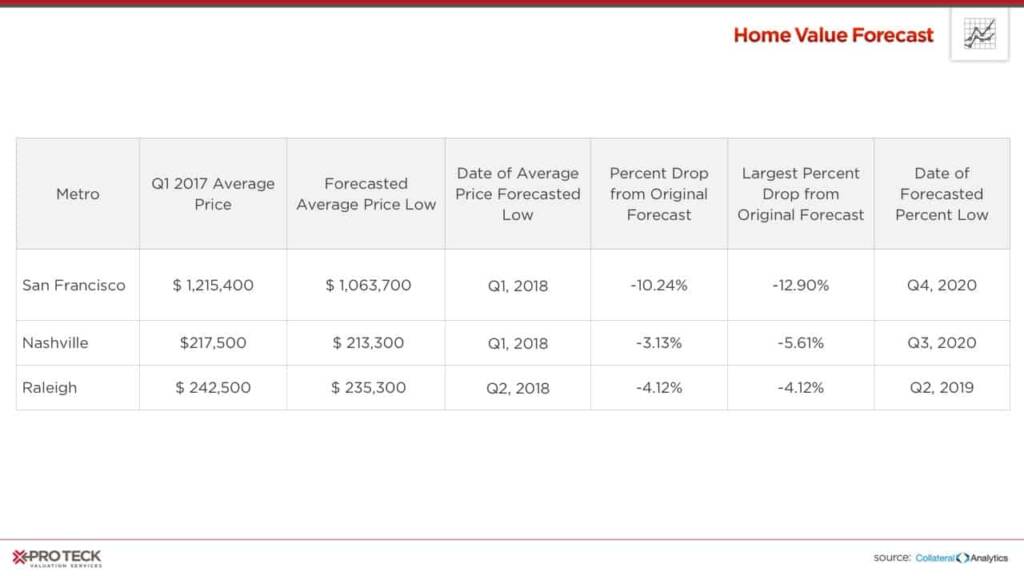
During this time of historic low interest rates, Home Value Forecast has been reporting about home prices hitting all-time highs in communities such as San Francisco, CA, Nashville, TN, and Raleigh, NC. The question now becomes — what happens if rates go up more than expected? Could we see a slowdown, or a reduction in home prices if it costs more to borrow money? The simple answer is, yes.
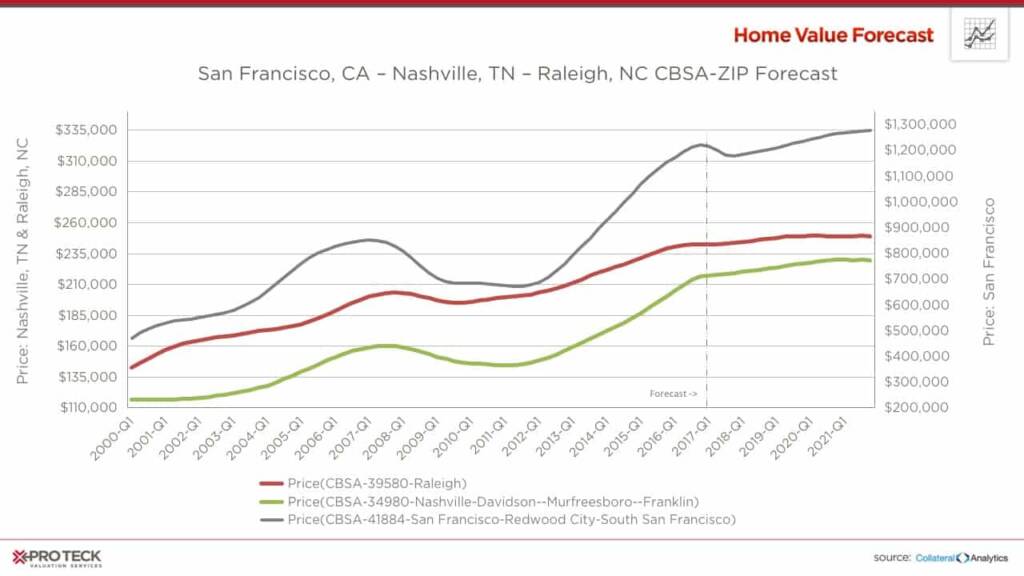
Above is the Collateral Analytics Home Price Forecast for the three metros mentioned earlier. As you can see, sale price appreciation is forecasted to taper off in all three as interest rates increase, with San Francisco already anticipated to experience a slight dip due to the two rate increases from the Fed over the last several months.
What If Rates Rise Even Further Than Forecasted?
One major hypothetical question looming over the market is: What will happen if interest rates increased 10% or 25% more than forecasted?
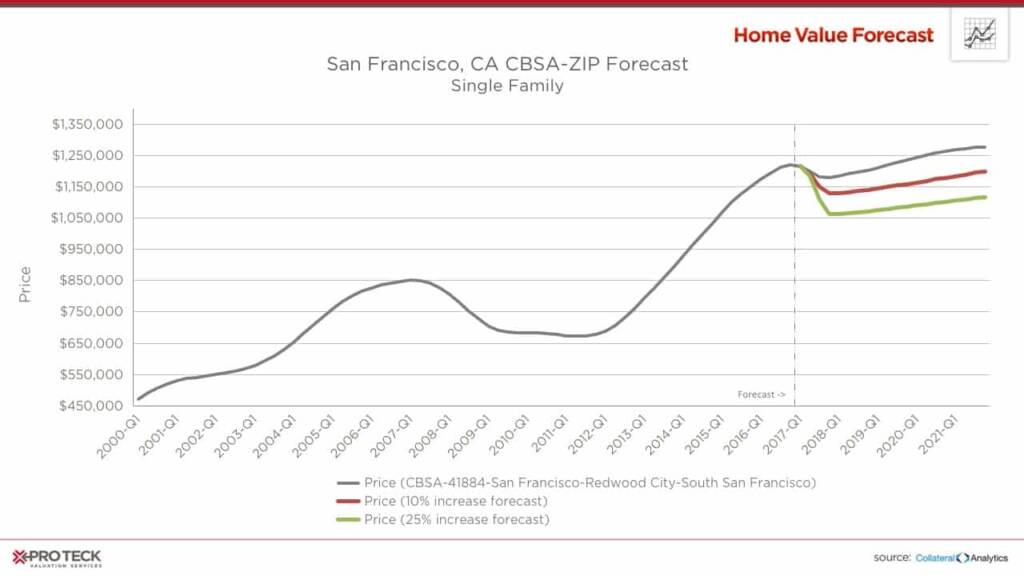
Below are the Collateral Analytics home price forecast scenarios keeping household income and employment forecasts the same for San Francisco with a 10% or 25% increase in forecasted mortgage interest rates:
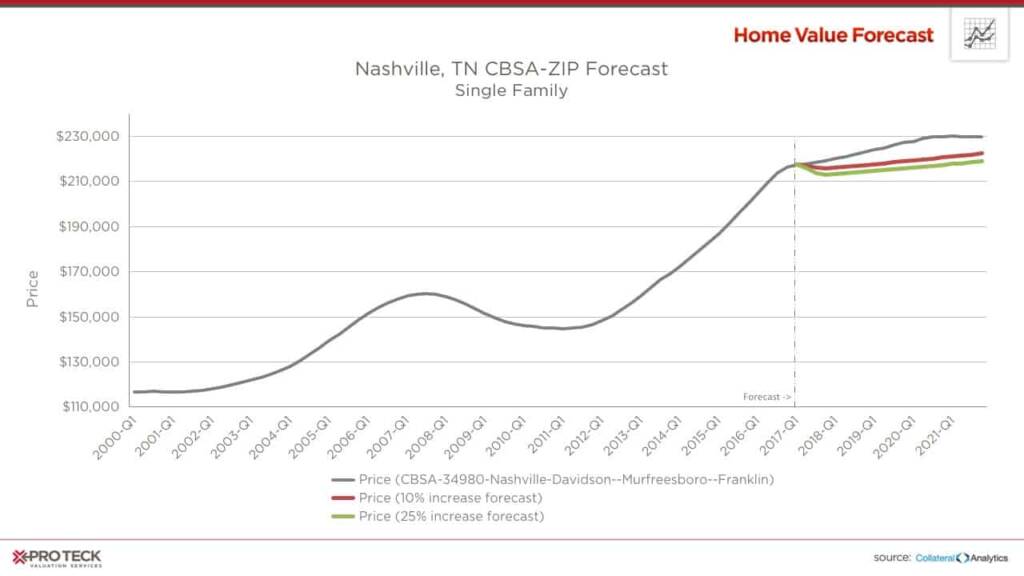
The same can be seen for Nashville:
And Raleigh:
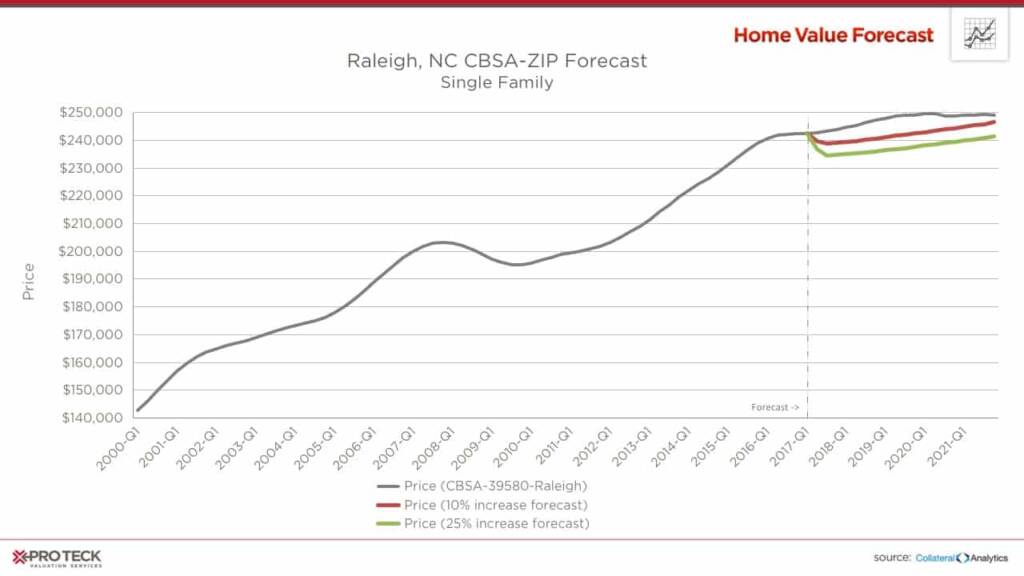
As can be seen in the graphs above, the models predict that each metro would experience some sort of home price reduction if rates rise more than anticipated. San Francisco, because of its already high cost of housing and lower affordability, would feel more of an impact from a rate hike than the other two metros, with prices dropping over 10% versus less than half that (3-4%) for Nashville and Raleigh.
The Role of Affordability
Affordability is calculated by looking at the median income for a particular area as a ratio to the mortgage payment needed to purchase a median priced home. An index score above 100 signifies that a household earning the median income has more than enough income to afford the mortgage. Lower scores suggest more income is needed to cover mortgage expenses.
The Collateral Analytics Affordability Index used by Home Value Forecast also looks at loan-to-value norms for a particular area to adjust for more affluent buyers usually putting more money down.
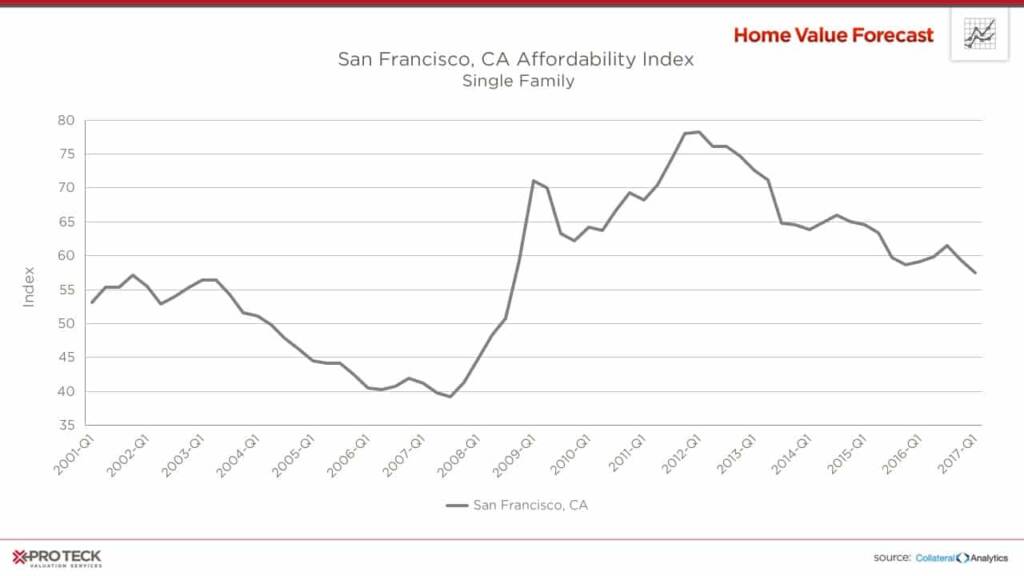
San Francisco’s affordability is at 59. Comparatively, both Nashville and Raleigh have affordability scores in the 170s. With an affordability score indicating that residents there put more money toward housing than most, it is clear that the San Francisco market is more sensitive to interest rate changes — and could see the biggest impacts from an aggressive hike in rates.
In the next few months, we might hear the word “bubble” in the news when describing the San Francisco housing market. At Home Value Forecast, we believe that today’s tighter lending practices will help protect us from experiencing anything like the crash from 10 years ago. Today’s hot markets like San Francisco are being driven by supply-demand market fundamentals, and any “dip” in pricing is just a reflection of those fundamentals at work.
CBSA Winners and Losers
Each month, Home Value Forecast uses a number of leading real estate market-based indicators to rank the single-family home markets in the top 200 CBSAs and highlight the strongest and weakest metros.
The ranking system is purely objective and is based on directional trends. Each indicator is given a score based on whether the trend is positive, negative or neutral for that series. For example, a declining trend in active listings would be positive, as will be an increasing trend in average price. A composite score for each CBSA is calculated by summing the directional scores of each of its indicators. From the universe of the top 200 CBSAs, each month we highlight the CBSAs that have the highest and lowest composite scores.
The tables below show the individual market indicators that are being used to rank the CBSAs, along with the most recent values and the percent changes. We have color-coded each of the indicators to help visualize whether they are moving in a positive (green) or negative (red) direction.
Top 10 CBSAs
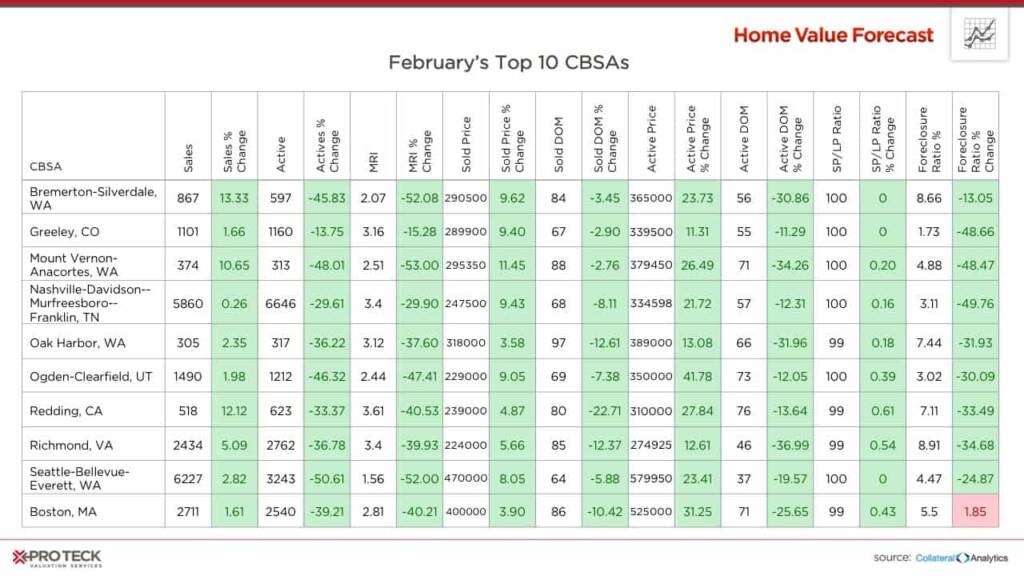
Once again, the Top Ten is all about supply, with all ten metros experiencing an increase in sales, a decrease in active homes on the market and a reduction in active days on the market.
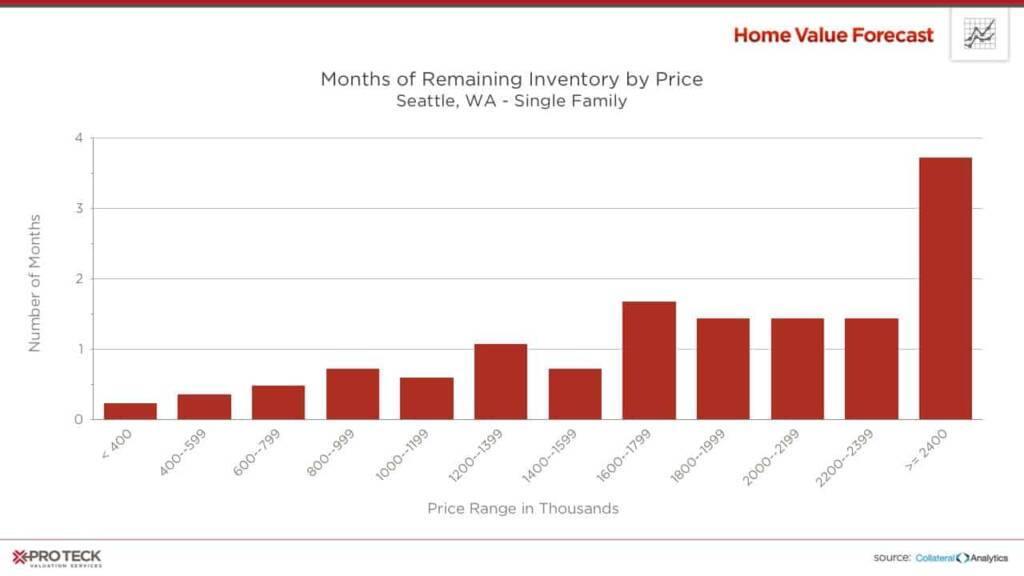
Seattle has the lowest Months of Remaining Inventory (1.56) and lowest active days on market (37). And as has been the case, the lower end of the market is the tightest, with MRI for homes selling for under $400,000 at 0.24, and all homes under $800,000 less than 0.5.
Bottom 10 CBSAs
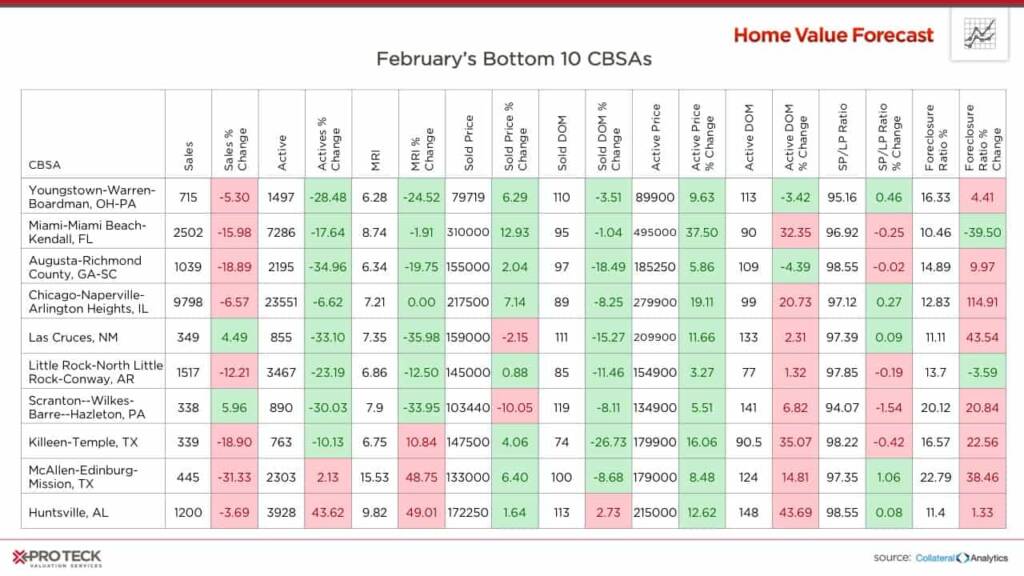
Eight of the Bottom Ten CBSAs have experienced a negative percent change in active listings (a healthy sign), with only the McAllen-Edinburg-Mission, TX, and Huntsville, AL, metros showing an increase. Six of the bottom ten also saw a decrease in MRI.
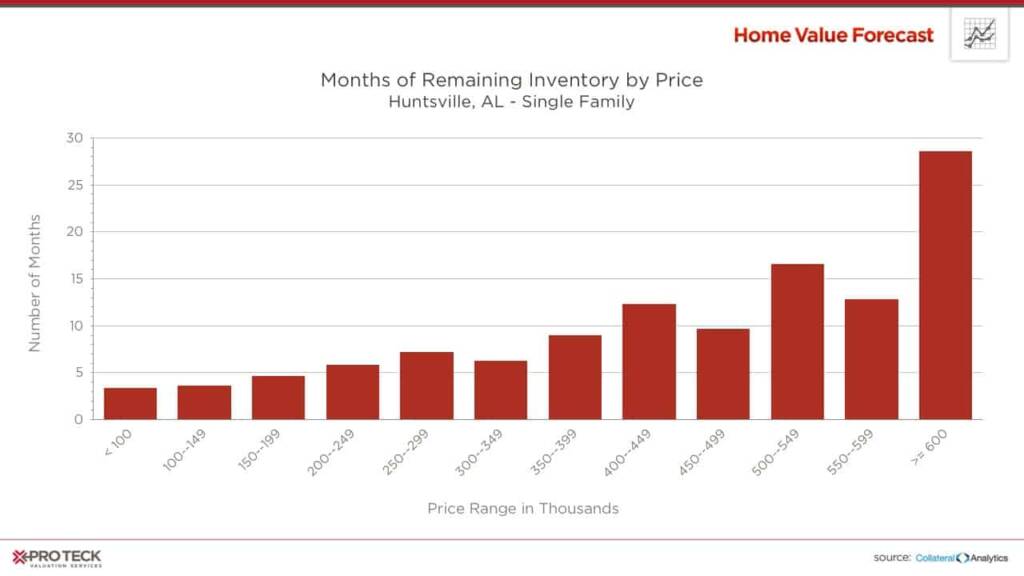
Looking at the MRI graph for the Huntsville, AL, metro, it’s once again evident that the bottom of the market is the most competitive, with less than five months MRI for homes costing less than $200,000. Higher priced homes seem to be staying on the market for extended periods. For example, homes priced between $500,000 and $549,000 remain on the market for an average of 17 months.
About Home Value Forecast
Home Value Forecast (HVF) is brought to you by SVI. HVF provides insight into the current and future state of the U.S. housing market, and delivers 14 market snapshot graphs from the top 30 CBSAs.
HVF is built using numerous housing and economic data sources. The top 750 CBSAs as well as data down to the ZIP code level for approximately 18,000 ZIPs are available with a corporate subscription to the service.
Also, SVI offers reporters the following:
- National, regional or metro level housing data
- Monthly updates and HVF insights articles
- By-request data for your story — custom data, heat maps and charts are available
- Expert commentary from the Home Value Forecast Editorial Committee:
- Tom O’Grady, Chief Executive Officer, Pro Teck Valuation Services
- Michael Sklarz, Ph.D., President, Collateral Analytics
- Jeff Dickstein, Chief Compliance Officer, Pro Teck Valuation Services