Home Value Forecast
Home Value Forecast: Live Free or Buy – New Hampshire Dominates Top 10 Hottest Markets
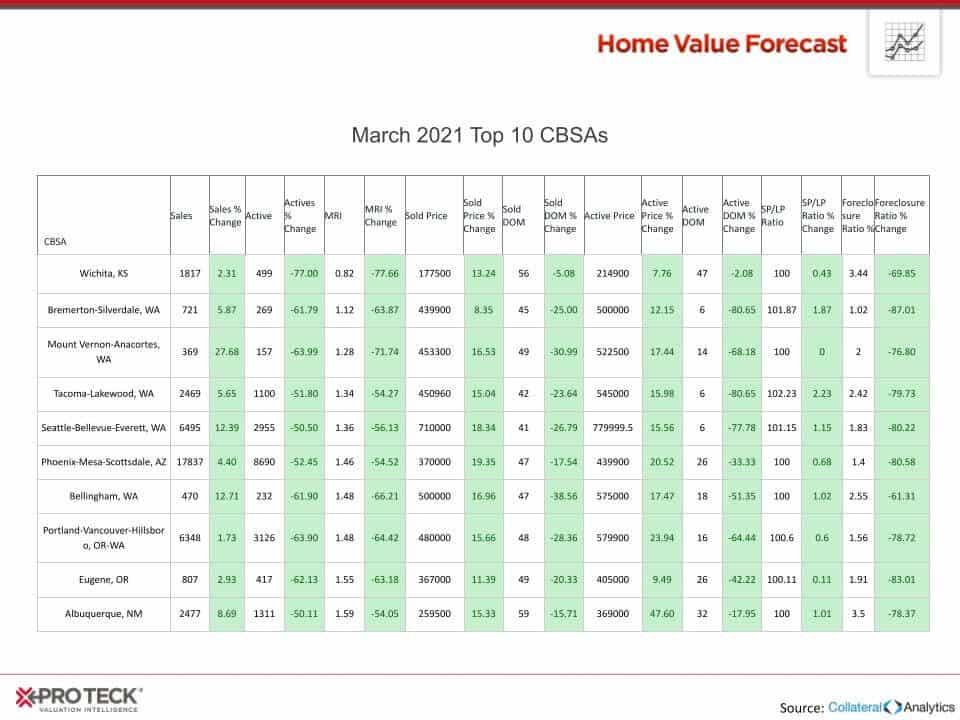
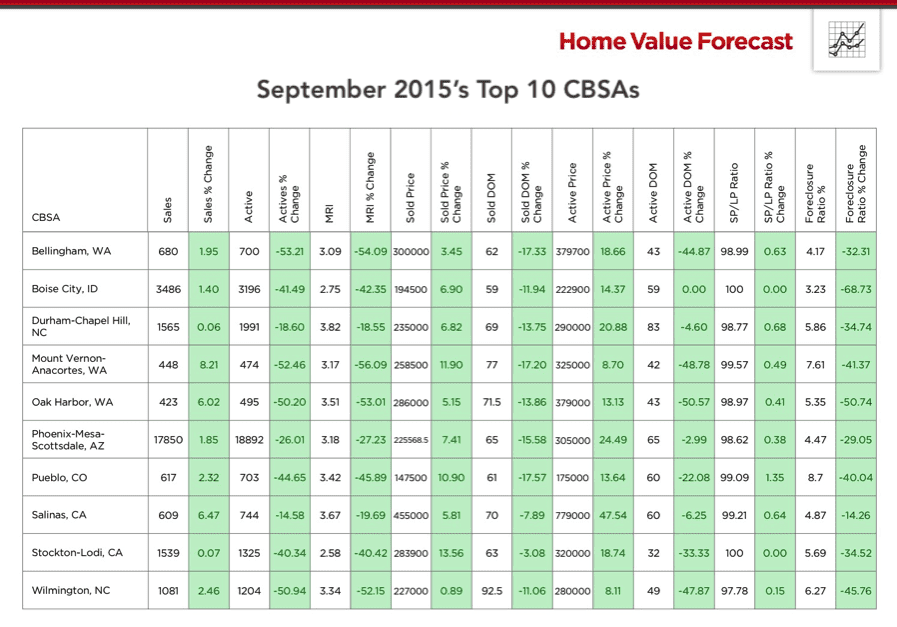
Each month, Home Value Forecast uses a number of leading real estate market-based indicators to report on activity in the single-family home markets in the top 200+ metropolitan areas (CBSAs) in the U.S., and reports on the Top 10.
The Top 10
The Home Value Forecast Top 10 ranking system is purely objective and is based on directional trends. It’s not a listing of what markets are most expensive or most in need of inventory — it ranks market momentum at a specific point in time.
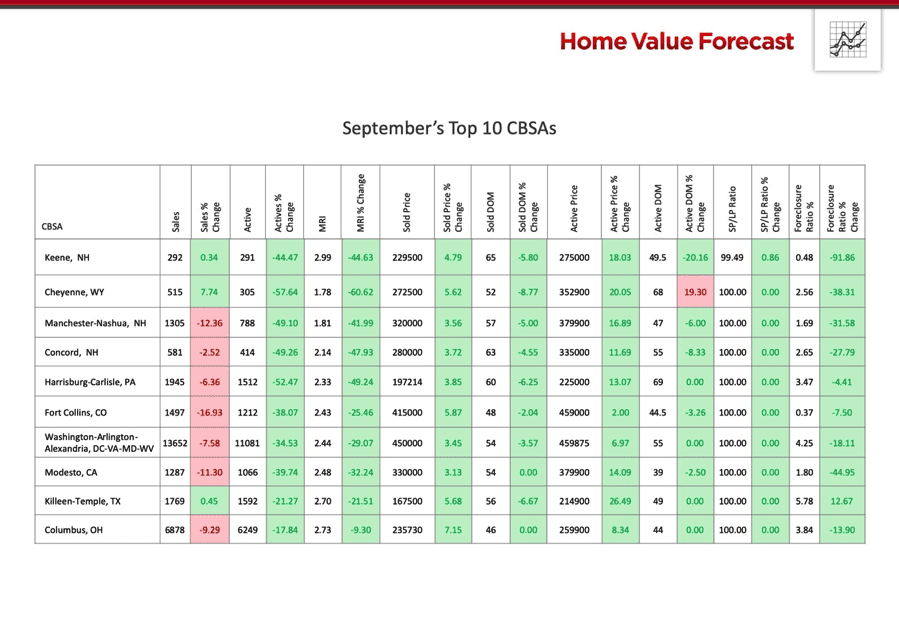
This month’s Top 10 metros includes six from the eastern half of the nation, led by three New Hampshire CBSAs:
The State of New Hampshire
Three New Hampshire metros made our Top 10 list this month, with the Keene, Manchester-Nashua and Concord CBSAs all showing Months of Remaining Inventory (MRI) under three, double digit increases in Active Price Change and low foreclosure inventory.
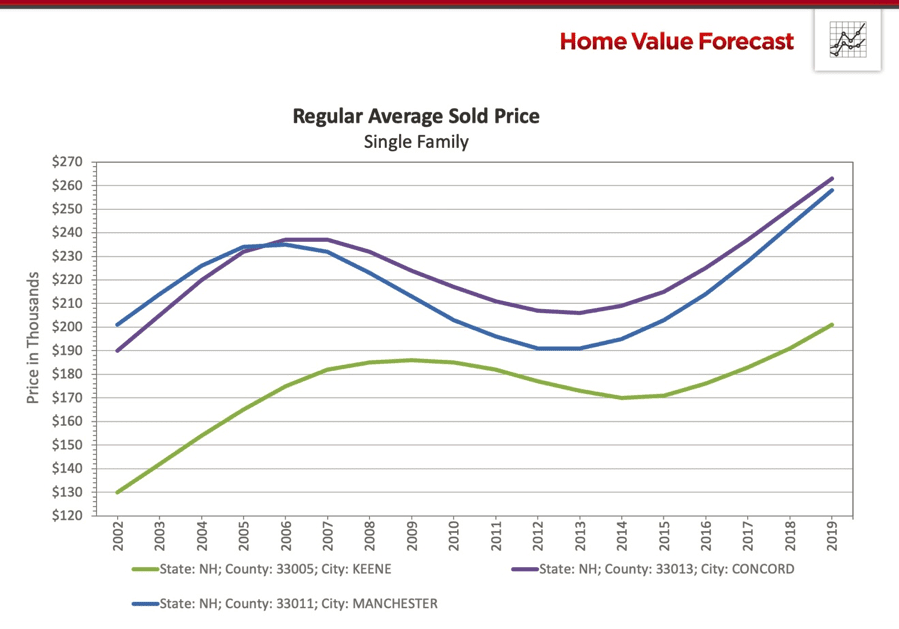
All three hit their post-crash lows later in 2013 and 2014 and have been appreciating ever since. Comparing the three New Hampshire price graphs to that of Mesa, Arizona shows how these eastern metros have experienced a later recovery:
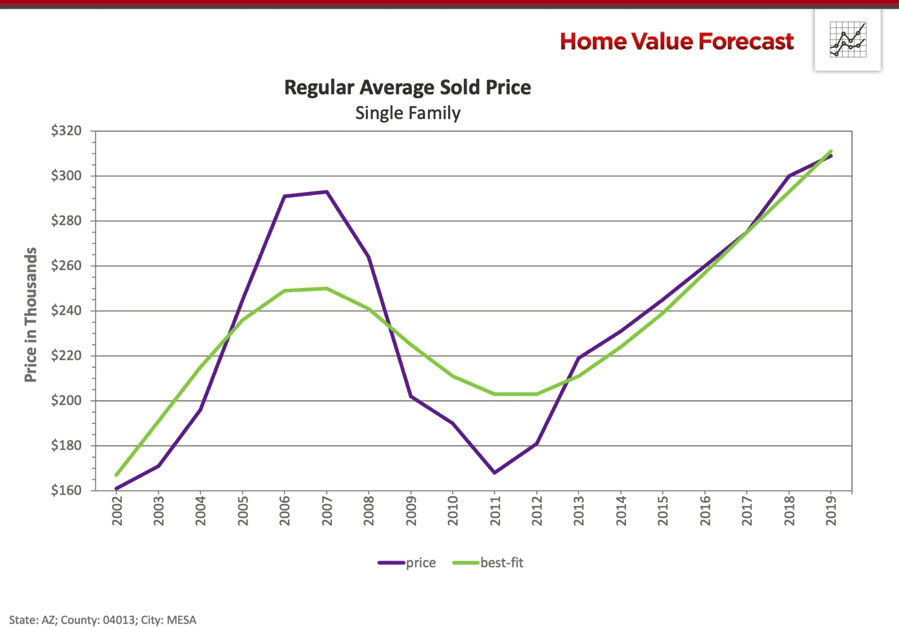
Mesa, like many western metros hit its post-crash low earlier (in 2011) and experienced their rebound earlier too. Looking back at our Top 10 from four years ago you can see it was dominated by western metros (eight) and two North Carolina “sun belt” metros.
Now that the pace of change has slowed in the west and south, we anticipate seeing more east and mid-west metros land on our Top 10 list in the months to come.
Interested in learning more about the top metros featured in this month’s market report? Contact SVI for more in-depth information on each CBSA listed in this month’s report.
About SVI’s Monthly Housing Market Report
The Home Value Forecast uses a ranking system that is purely objective and is based on directional trends of nine market indicators. Each indicator is given a score based on whether the trend is positive, negative or neutral for that series. For example, a declining trend in active listings would be positive, as would an increasing trend in average price. A composite score for each CBSA is calculated by summing the directional scores of each of its indicators. From the universe of the top 200 CBSAs, each month we highlight topics and trends in the real estate market.