Home Value Forecast
Home Value Forecast: Sweet Carolina – North Carolina Closing the Year on High Note
Each month, Home Value Forecast uses a number of leading real estate market-based indicators to report on activity in the single-family home markets in the top 200+ metropolitan areas (CBSAs) in the U.S., and reports on the Top 10.
THE TOP 10
The Home Value Forecast Top 10 ranking system is purely objective and is based on directional trends. It’s not a listing of what markets are most expensive or most in need of inventory — it ranks market momentum at a specific point in time.
This month’s Top 10 again features metros from the eastern half of the nation, this time led by three CBSAs from North Carolina:
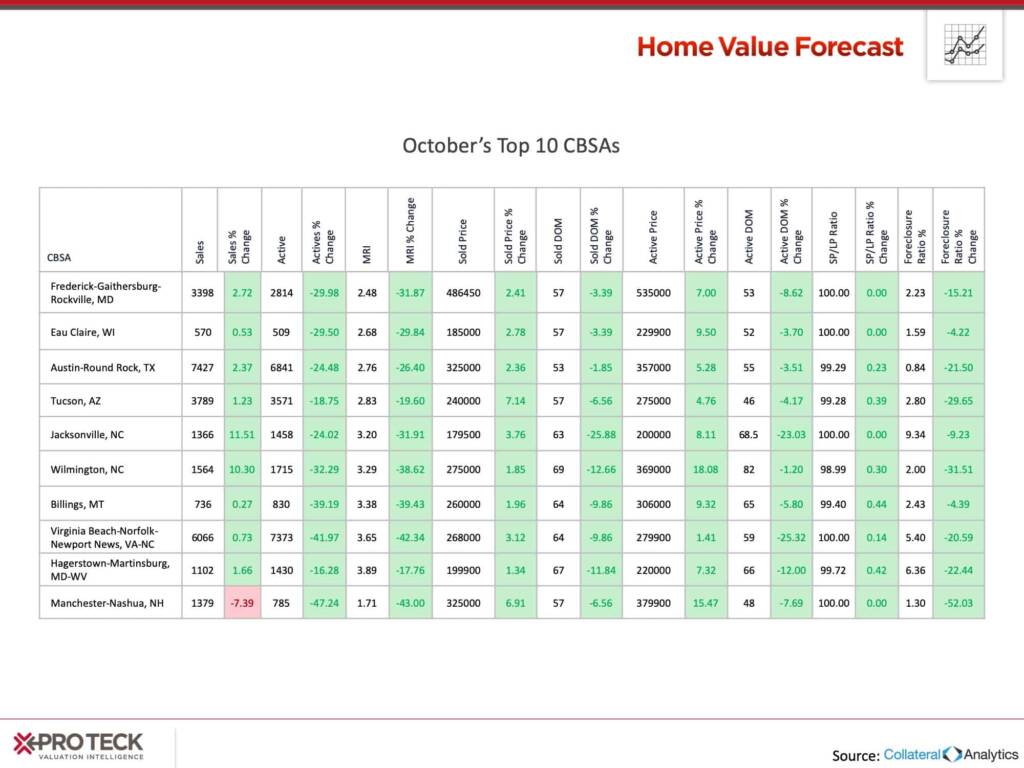
NORTH CAROLINA
The three North Carolina CBSAs include Jacksonville, Wilmington and Virginia Beach-Norfolk-Newport News, VA-NC. While the Virginia Beach-Norfolk-Newport News CBSA technically includes some northeast counties in NC, the CBSA market trends are driven by the Virginia markets.
In all three CBSAs, prices are rising and at or near all-time highs:
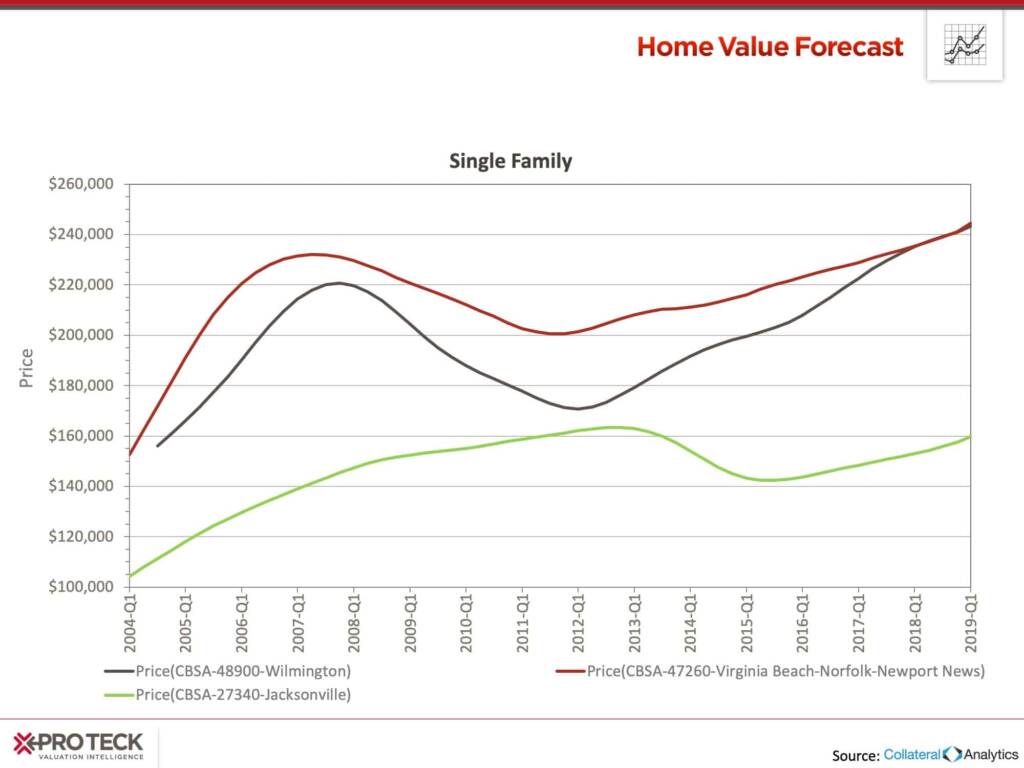
Wilmington, NC, has had the biggest swings in price of the three, with gains since 2012 highly correlated to increased employment.
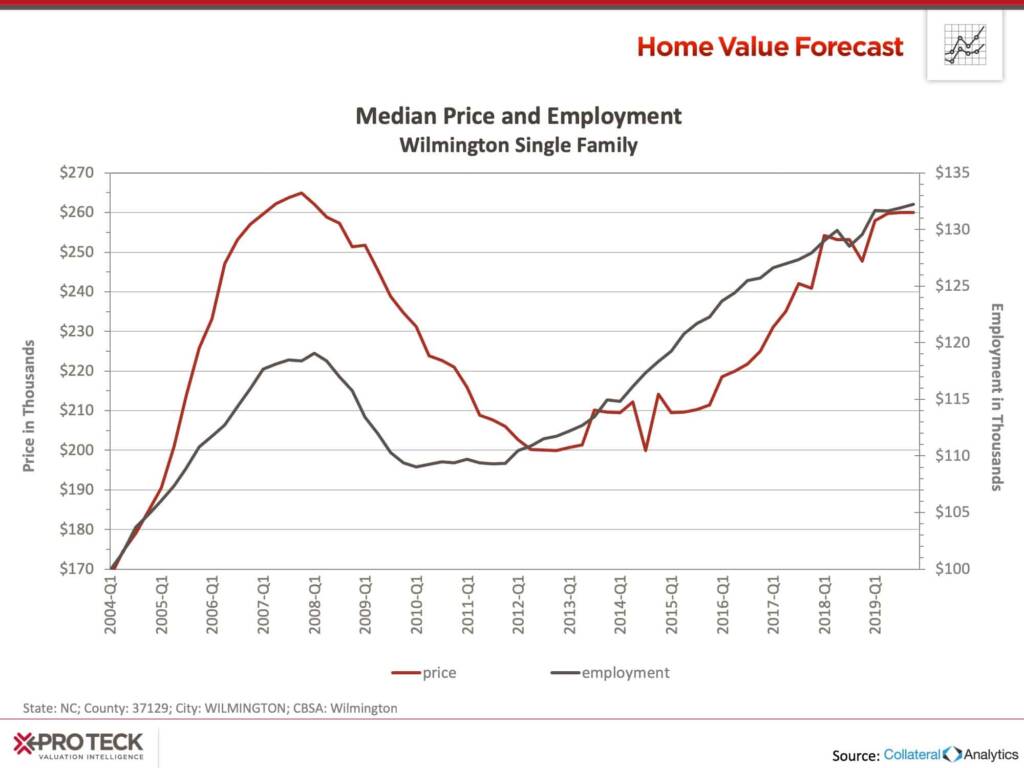
The 2007 peak was not tied to employment gains, as can be seen by the “bubble” in the Affordability Index in 2006-2007.
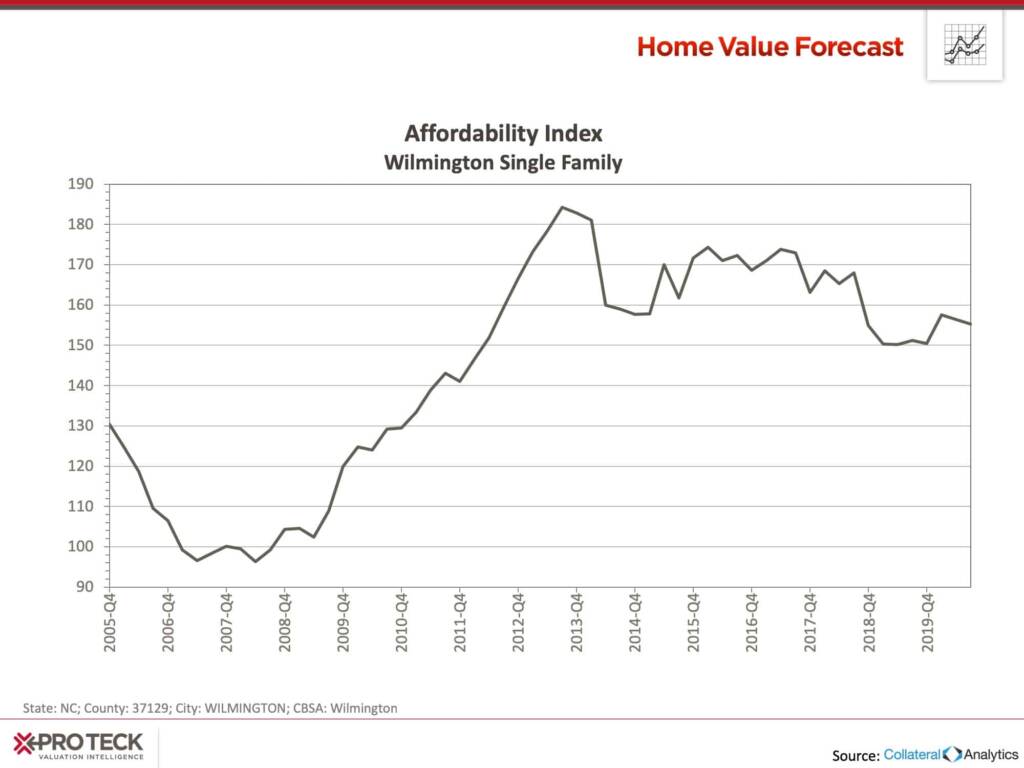
The Affordability Index is calculated by looking at the ratio of median income for an area compared to the mortgage payment needed to purchase a median priced home. An index score above 100 signifies that a household earning the median income has more than enough income to afford the mortgage. Lower scores suggest more income is needed to cover mortgage expenses.
While affordability in Wilmington bottomed out in 2007, prices were still affordable for middle income families. Today, Wilmington affordability is around 150, making home ownership available to more people. This is a far cry from San Francisco, where the Affordability Index is at a 46.
When more families are able to afford homes, demand increases. Wilmington’s current Months of Remaining Inventory (MRI) is 3.29 months, an indicator of a very competitive seller’s market compared to when the market is balanced (6 to 8 months MRI).
Making matters worse, competition at the lower end of the market (below $350,000) is even more fierce.
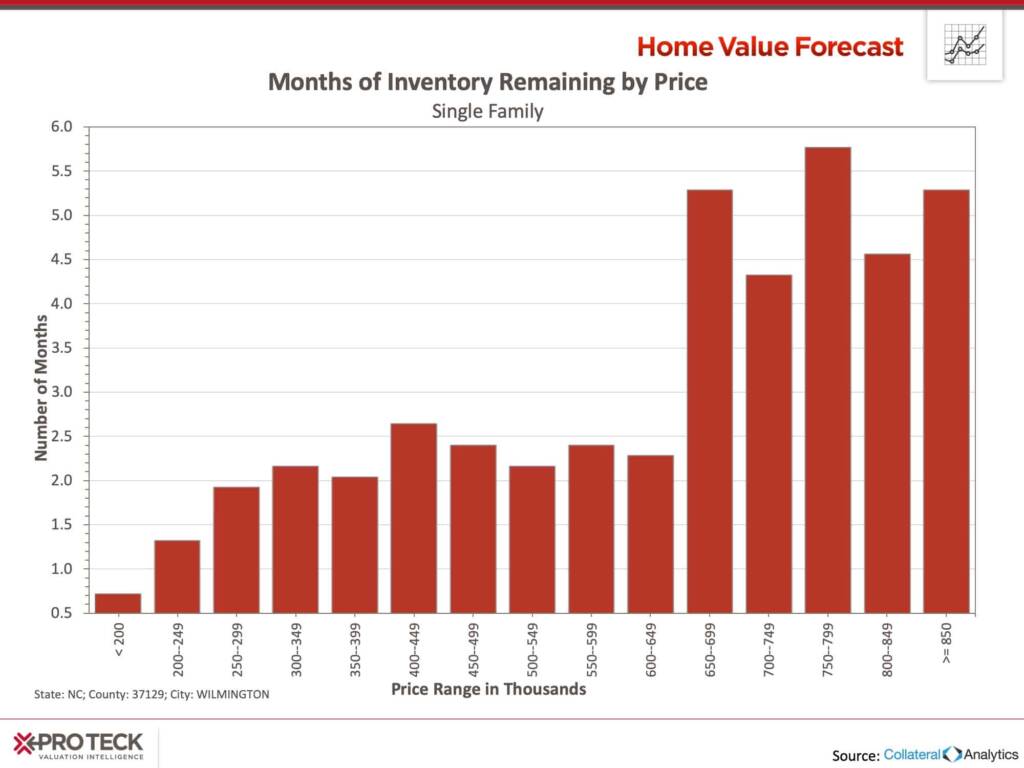
“Starter homes” are traditionally at lower price points, right now homes below $200,000 have a 0.7 MRI, $200 – $249,000 at 1.3 MRI. The average home in Wilmington sells in the $300,000 – $350,000 range – there the MRI was 2.2. With demand higher than supply, we expect prices to continue to climb.
ABOUT SVI’S MONTHLY HOUSING MARKET REPORT
The Home Value Forecast uses a ranking system that is purely objective and is based on directional trends of nine market indicators. Each indicator is given a score based on whether the trend is positive, negative or neutral for that series. For example, a declining trend in active listings would be positive, as will be an increasing trend in average price. A composite score for each CBSA is calculated by summing the directional scores of each of its indicators. From the universe of the top 200 CBSAs, each month we highlight topics and trends in the real estate market.