Home Value Forecast
The Happiest Place on Earth (for Sellers): Orlando-Kissimmee-Sanford Housing Market is Heating Up
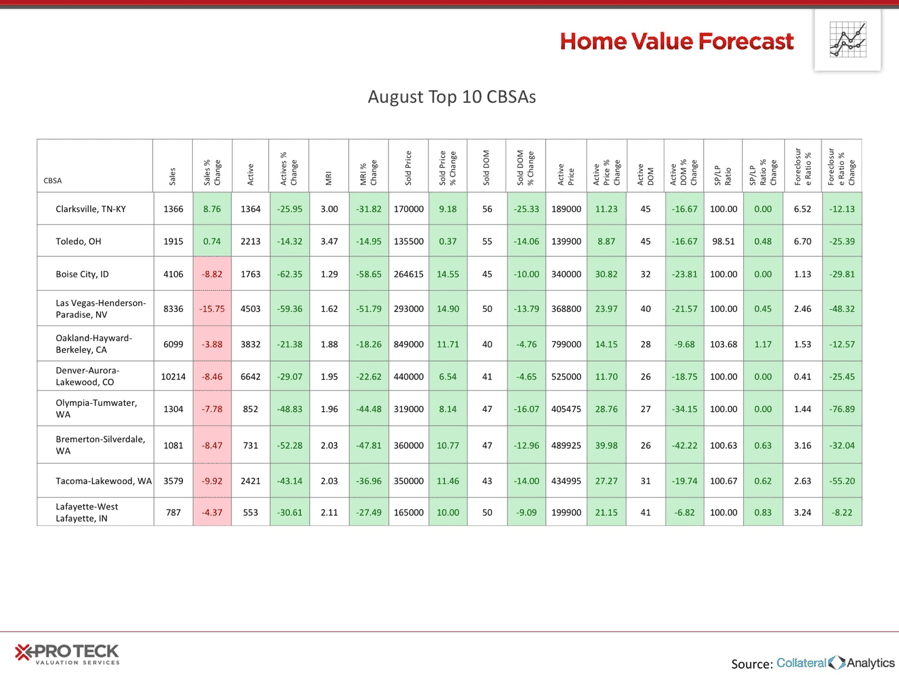
Each month, HVF’s Housing Market Report uses a number of leading real estate market-based indicators to report on activity in the single-family home markets in the top 200 metropolitan areas (CBSAs) in the U.S.
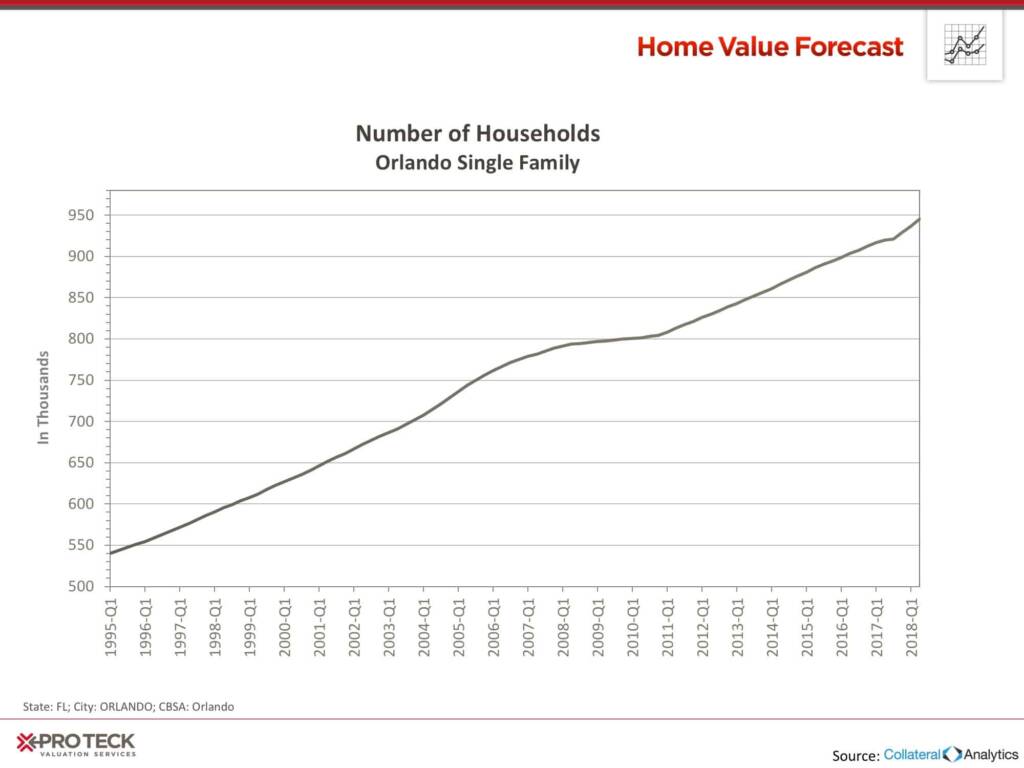
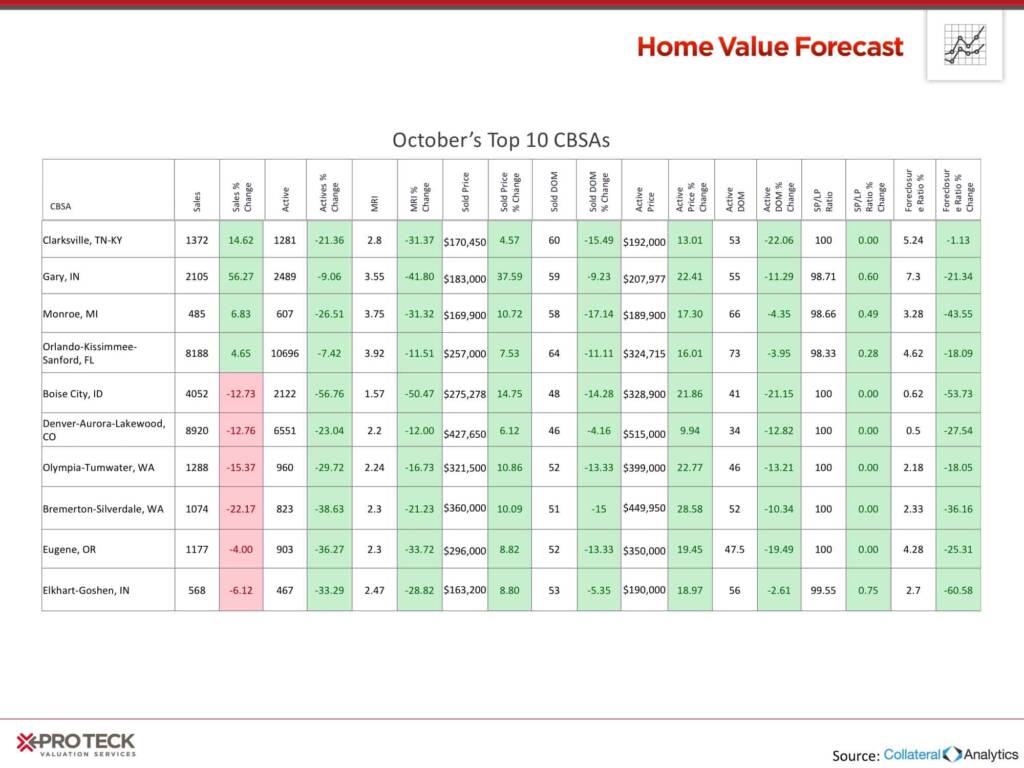
In this month’s Housing Market Report, we take we look at the Orlando-Kissimmee-Sanford market, one of the fastest-growing metros on our Top 10 Hottest Housing Markets list. Forbes named Orlando the fourth-fastest growing city in the country, with the number of single-family households continually rising. An area synonymous with the mouse ears and other tourist attractions is drawing people in to stay. But why?
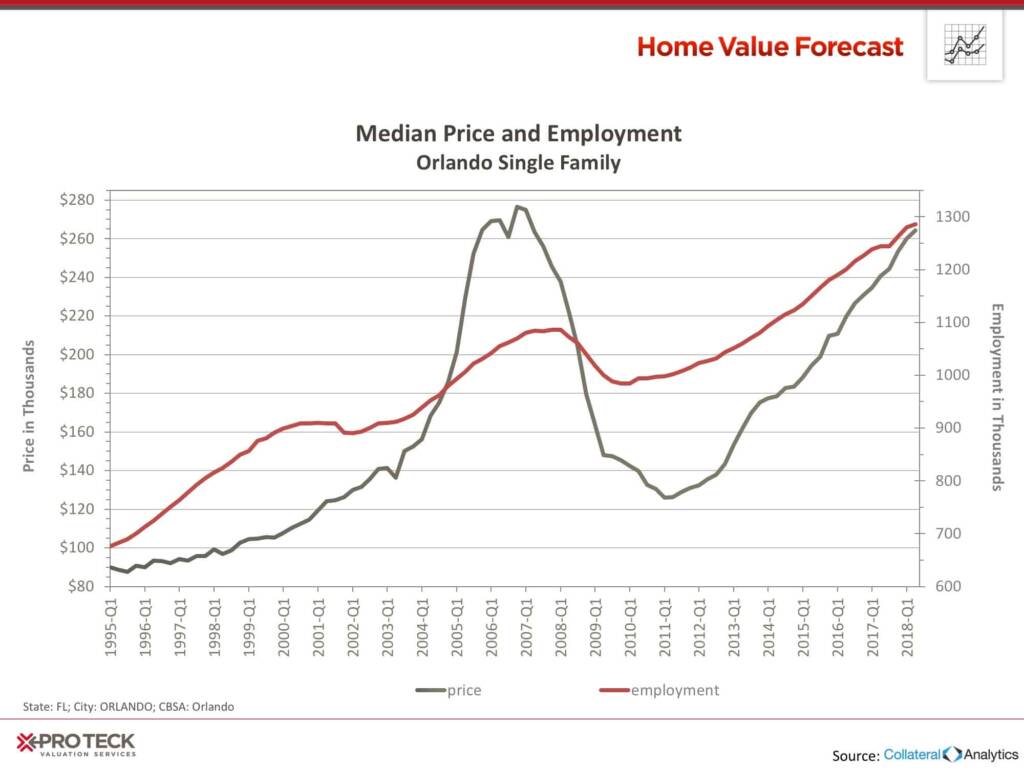
It starts with job opportunities. The Orlando jobs market is seeing sustained, positive growth, up 3.5% in the month of May and 44,000 new jobs added in the last year. The correlation of new jobs to increased housing prices is significant, as housing prices are increasing and will continue to grow, a projected 35%, from 2017 – 2020.
Of our Top 10 housing markets, Orlando had the second-most sales, with 8,188 . The Orlando-Kissimmee-Sanford metro also has the most active listings, with 10,696.
Top Ten
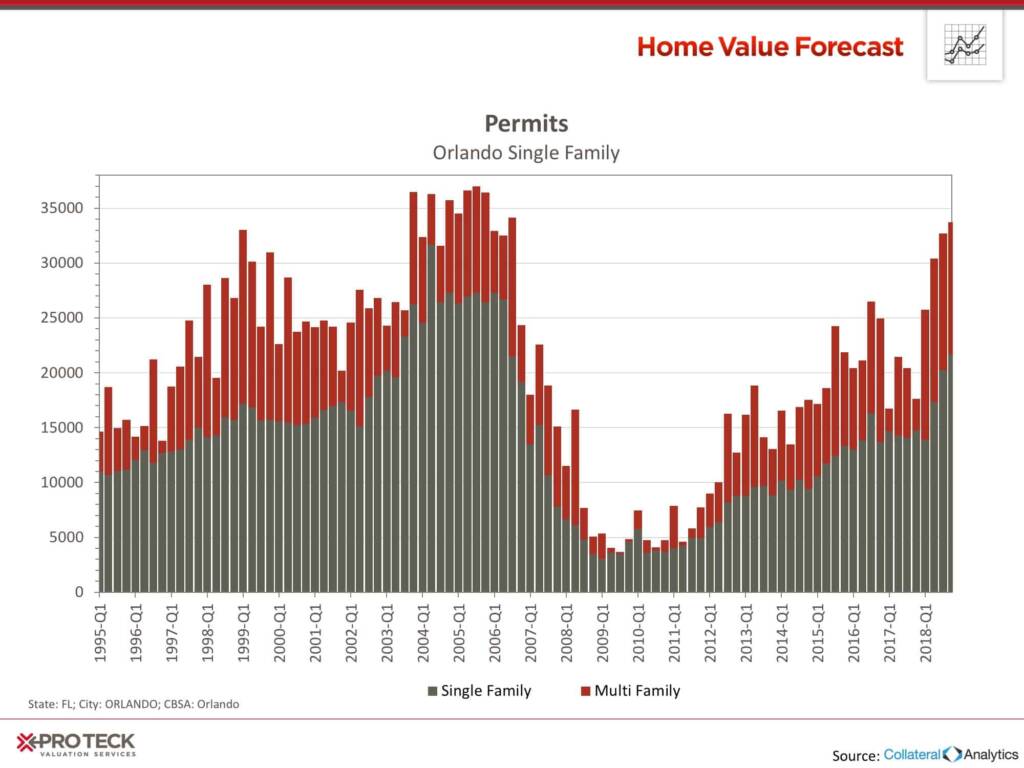
It’s not just existing homes that are selling like crazy. After a drastic drop-off in new-build following the financial crash in 2008, single-family building permits are rising rapidly, with nearly 35,000 permits issued in Q1 of 2018.
Interested in learning more about the top metros featured in this month’s market report? Contact us for more in-depth information on each CBSA listed in this month’s report.
About the Monthly Housing Market Report
The Home Value Forecast uses a ranking system that is purely objective and is based on directional trends of nine market indicators. Each indicator is given a score based on whether the trend is positive, negative or neutral for that series. For example, a declining trend in active listings would be positive, as would an increasing trend in average price. A composite score for each CBSA is calculated by summing the directional scores of each of its indicators. From the universe of the top 200 CBSAs, each month we highlight topics and trends in the real estate market.