Home Value Forecast
HVF Monthly Housing Report: Holy Toledo! The Glass City Cracks the Top 10
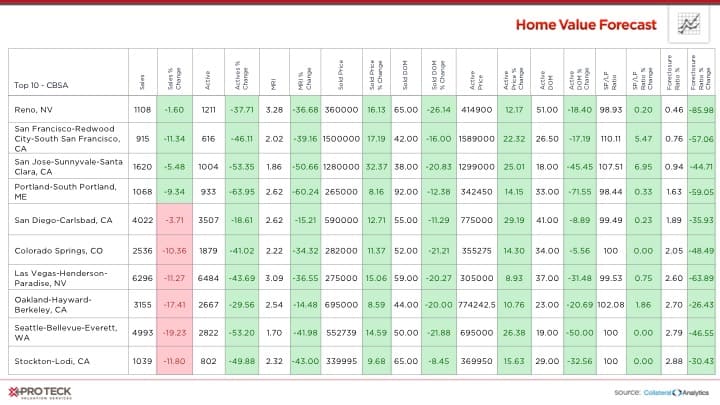
Each month, HVF’s Housing Market Report uses a number of leading real estate market-based indicators to report on activity in the single-family home markets in the top 200 metropolitan areas (CBSAs) in the U.S.
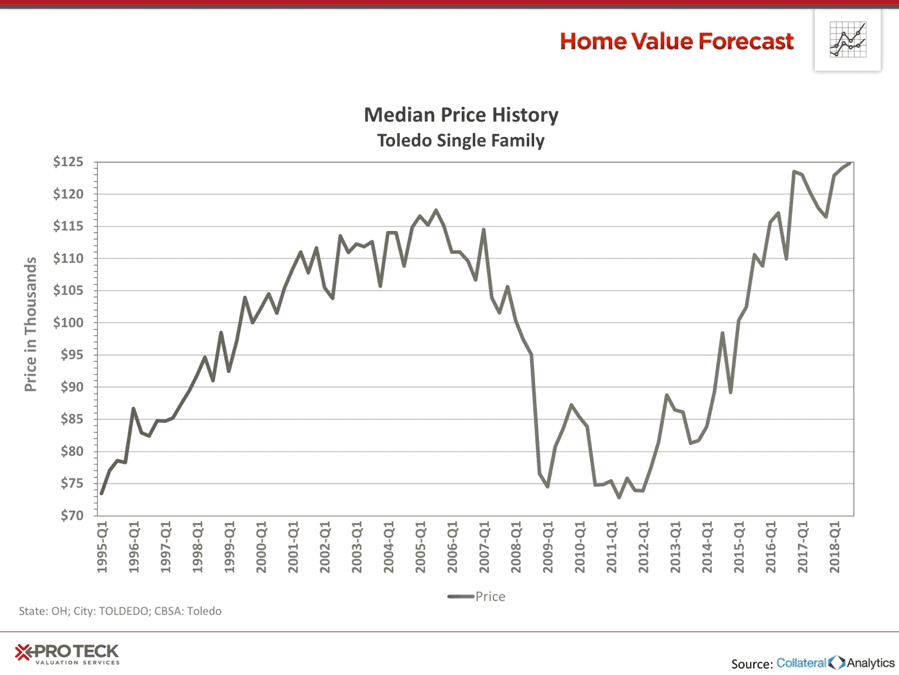
In this month’s Housing Market Report, we take a closer look at Toledo, Ohio, a fresh face on our list of Top 10 Hottest Housing Markets. The current news cycle is inundated with stories about nationwide housing markets favoring the sellers – inventories are going down, while sales keep trending up. Toledo, an up-and-coming market catering to telecommuters and first-time homeowners, proves that price is always king.
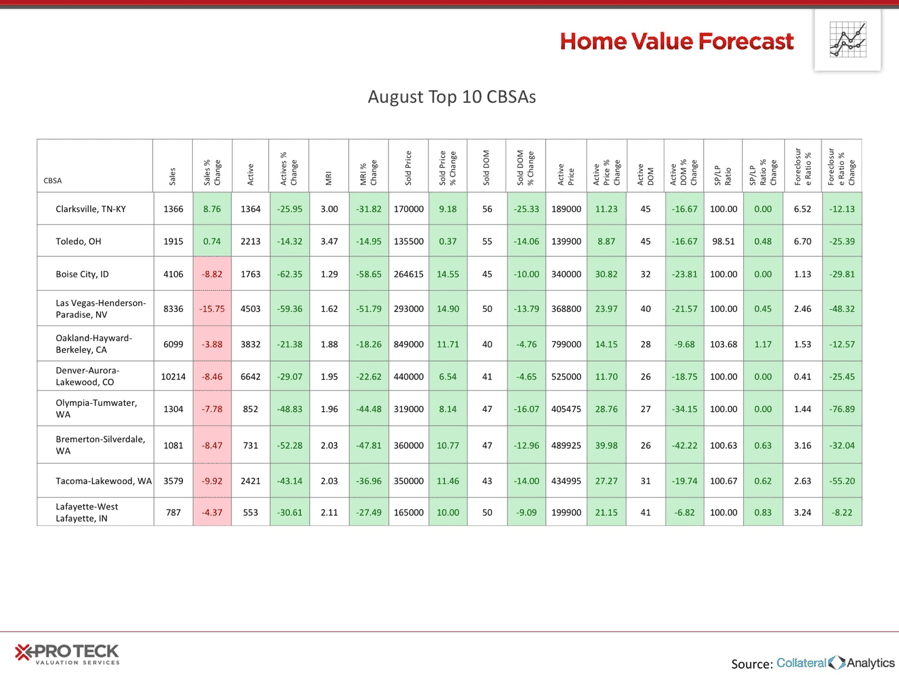
Of our Top 10 housing markets, Toledo had the lowest Average Sold Price ($135,000) and the smallest Sales Price Percentage Change.
Toledo was recently named the #2 market for first-time homebuyers, a demographic that had been put off by the high-priced market trends as of late. But, with a buyers’ housing market with over 3.47 Months Remaining Inventory (the most of our top 10), minimal pricing fluctuations and its Sales Percentage Change increasing, Toledo seems primed to make a bigger splash.
But, why Toledo? With the advent of communication technologies that enable telecommuting, finding an affordable home in a community with good schools (#5 high school in the state) and rising property values makes sense for many millennials. Toledo is less than two hours from major metropolitan areas – Detroit, Cleveland and Columbus – where housing prices are much higher.
Interested in learning more about the top metros featured in this month’s market report? Contact SVI for more in-depth information on each CBSA listed in this month’s report.
About SVI’s Monthly Housing Market Report
The Home Value Forecast uses a ranking system that is purely objective and is based on directional trends of nine market indicators. Each indicator is given a score based on whether the trend is positive, negative or neutral for that series. For example, a declining trend in active listings would be positive, as would an increasing trend in average price. A composite score for each CBSA is calculated by summing the directional scores of each of its indicators. From the universe of the top 200 CBSAs, each month we highlight topics and trends in the real estate market.