Home Value Forecast
Home Value Forecast Top 10, May 2023
Each month, Home Value Forecast uses a number of leading real estate market-based indicators to monitor single-family home market activity in the nation’s top 200+ metropolitan areas (CBSAs) and report on the Top 10.
THE TOP 10
The Home Value Forecast Top 10 Hottest Housing Markets ranking system is purely objective and is based on directional trends over the past eight quarters. It’s not a listing of what markets are most expensive or most in need of inventory; it ranks market momentum at a specific point in time.
This month’s Top 10:
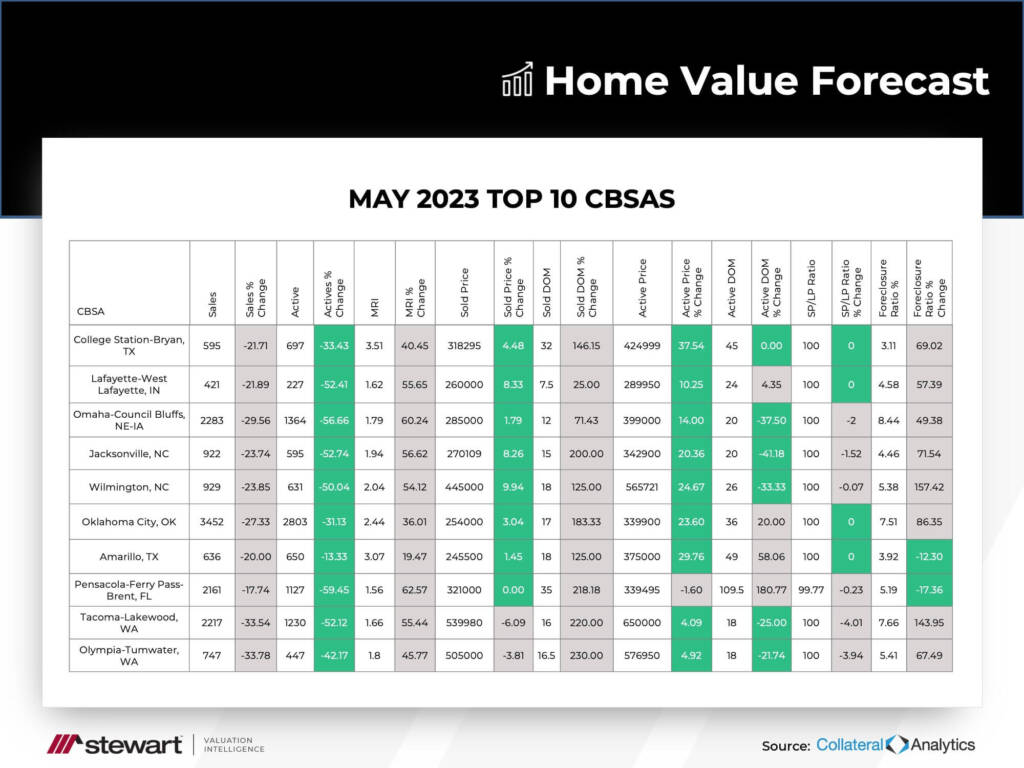
This month, three states — Texas, North Carolina and Washington — were represented with two metros each, while metros in Indiana, Nebraska, Oklahoma and Florida made up the other four.
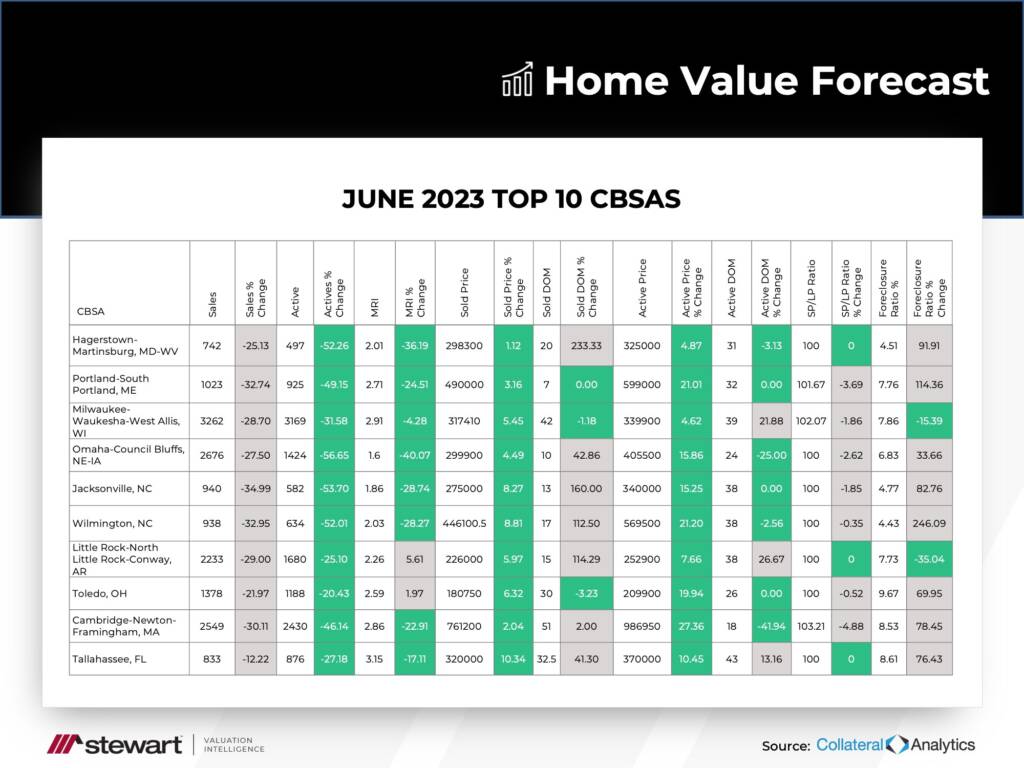
All ten metros have fewer sales and active listings than last year. Additionally, they all saw a rise in Months of Remaining Inventory (MRI) from historic lows. However, all still fall under four months of inventory, well below the “balanced-market” average of six months of inventory. In fact, only nine of the 229 metros we track have an MRI of six or more, indicating that inventory will be an issue for the foreseeable future.
What we’re seeing now is a slowdown caused by rising interest rates. People who were once considered likely to move are now opting to stay in their current homes thanks to historically low mortgage interest rates. Until the economy starts to settle, it’s a “wait and see” market.
Slow and Steady
The top 3 metros this month — College Station, Lafayette and Omaha — all experienced slow and steady growth over the last 15 years. For comparison, we’ve charted these 3 metros against Cape Coral-Fort Myers, Florida.
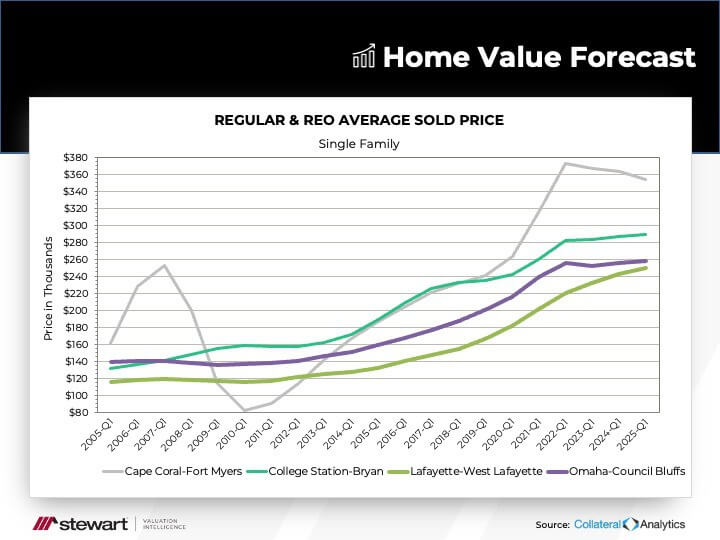
Like many other US metros, Cape Coral saw a steep decrease in prices after the real estate crash in 2008. Our top 3 metros this month saw no drastic sell-off post 2008, only slow and steady growth. Their forecasts also project price increases, compared to an adjustment in Cape Coral.
If high interest rates and recessionary trends persist, these slow and steady markets will continue to be at the top of our list.
ABOUT STEWART VALUATION INTELLIGENCE’S MONTHLY HOUSING MARKET REPORT
The Home Value Forecast uses a ranking system that is purely objective and based on directional trends of market indicators. Each indicator is given a score based on whether the trend is positive, negative or neutral for that series. For example, a declining trend in active listings would be positive, as would an increasing trend in average price. A composite score for each CBSA is calculated by summing the directional scores of each of its indicators.