Home Value Forecast
Home Value Forecast Top 10, June 2023
Each month, Home Value Forecast uses a number of leading real estate market-based indicators to monitor single-family home market activity in the nation’s top 200+ metropolitan areas (CBSAs) and report on the Top 10.
THE TOP 10
The Home Value Forecast Top 10 Hottest Housing Markets ranking system is purely objective and based on directional trends over the past eight quarters. It’s not a listing of what markets are most expensive or most in need of inventory; it ranks market momentum at a specific point in time.
This month’s Top 10:
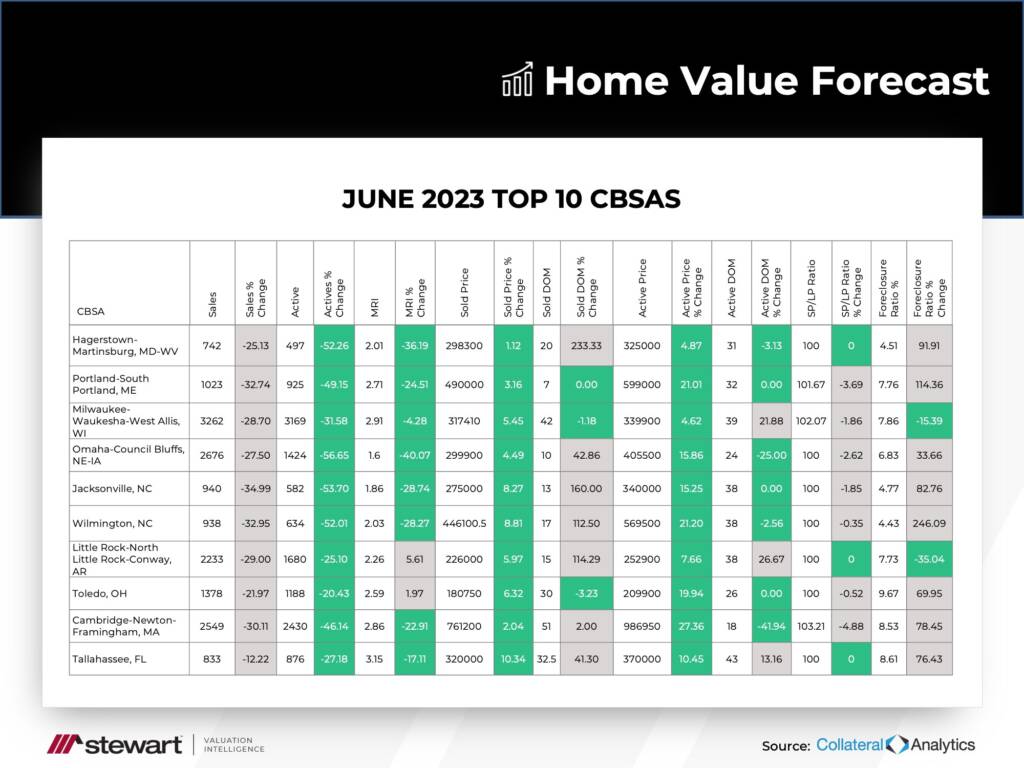
This month, metros from the eastern United States dominate the list with no representation from Top 10 regulars California, Oregon or Washington State. Eight of the 10 have had an increase in Foreclosesures as a Percent of Sales, with a range of 4.43% to 9.67%.
Usually, when foreclosures go up, you also see an increase in Months of Remaining Inventory (MRI) — that isn’t the case for this market, with tight inventory in all 10 metros.
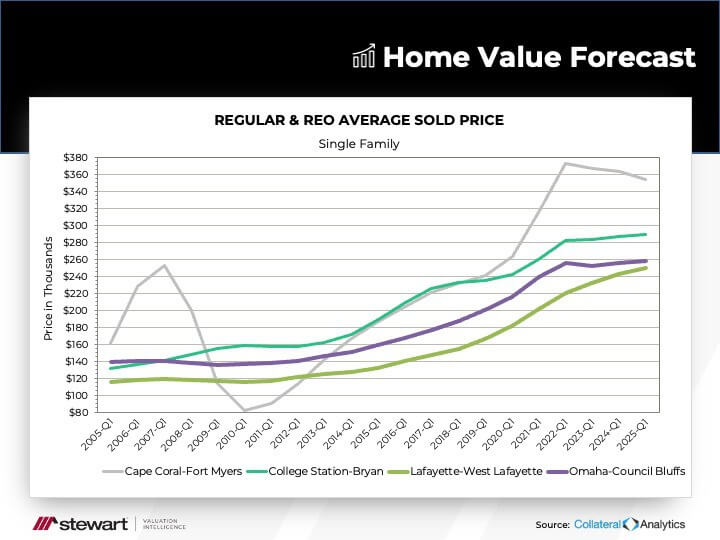
Average Sold Price
The Federal Reserve Bank of Saint Louis provides economic research data, including housing data, through its FRED database. FRED’s Average Sales Price of Houses Sold for the United States in Q1 2023 was $516,500. Nine of the top 10 metros this month had average sale prices below the national average, with Cambridge, MA ($761,200) being the only one above.
Last month’s Home Value Forecast mentioned that “slow and steady” metros were leading the Top 10, and this month, nine out of 10 metros offer proof of the same phenomenon with average sale prices under the national average. This goes to show that secondary markets are seeing modest gains as the top of the market cools off.
ABOUT STEWART VALUATION INTELLIGENCE’S MONTHLY HOUSING MARKET REPORT
The Home Value Forecast uses a ranking system that is purely objective and based on directional trends of market indicators. Each indicator is given a score based on whether the trend is positive, negative or neutral for that series. For example, a declining trend in active listings would be positive, as would an increasing trend in average price. A composite score for each CBSA is calculated by summing the directional scores of each of its indicators.