Home Value Forecast
Home Value Forecast: March Metrics & Maryland on the Move
Each month, Home Value Forecast uses a number of leading real estate market-based indicators to report on activity in the single-family home markets in the top 200+ metropolitan areas (CBSAs) in the U.S., and reports on the Top 10.
The numbers in this report were from late February, 2020, before COVID-19 had impacted the market. Sales and listings will be impacted in the coming months, HVF will be there to report on it.
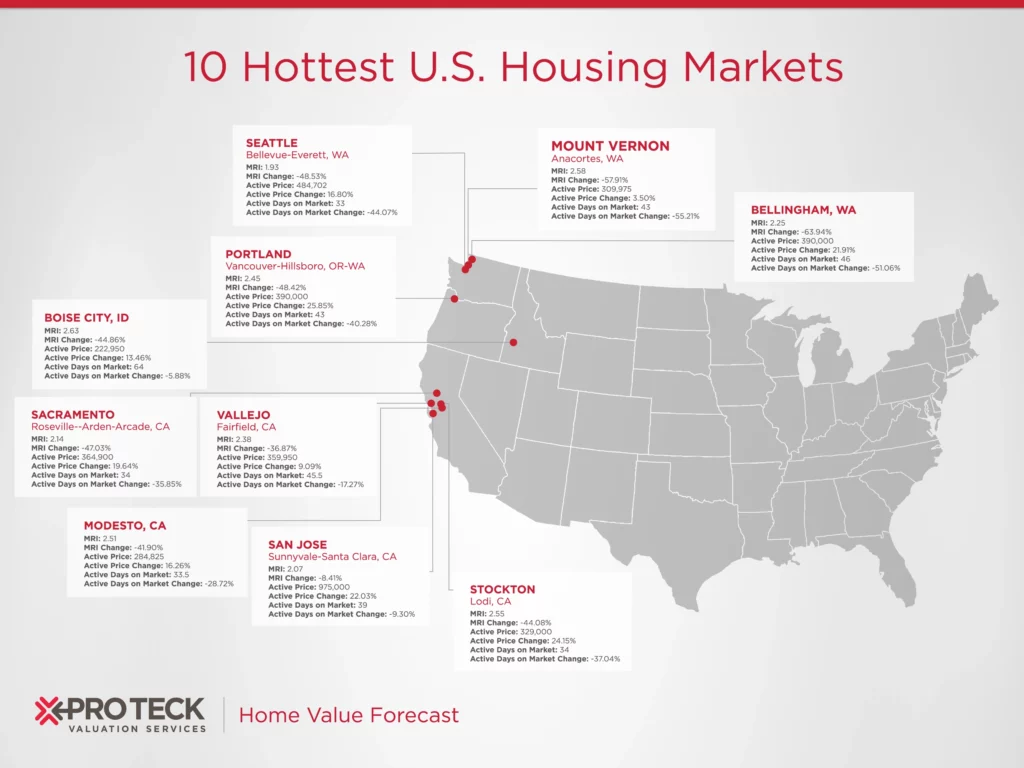
THE TOP 10
With San Francisco, Seattle, San Jose and other expensive markets that are traditionally deemed “hot” out of our Top 10 this month, we wanted to reintroduce our methodology.
The Home Value Forecast Top 10 ranking system is purely objective and is based on the directional trends of the following series:
- Number of Active Listings
- Average Sold Price
- Average Listing Price
- Number of Foreclosure Sales
- Number of Sales
- Number of New Listings
- Average Active Market Time
Using actual data over the past eight quarters, these trends are then defined as increasing, stable or decreasing. Each indicator is given a score based on whether the trend is positive, negative or neutral for that series. For example, a declining trend in number of active listings would be positive, as would be an increasing trend in average sold price. A composite score for each CBSA is calculated by summarizing the directional scores of each of its indicators, and is meant to identify those metros that have the highest probability of price appreciation over the next 6 to 24 months.
This month’s Top 10 includes three metros from Maryland:
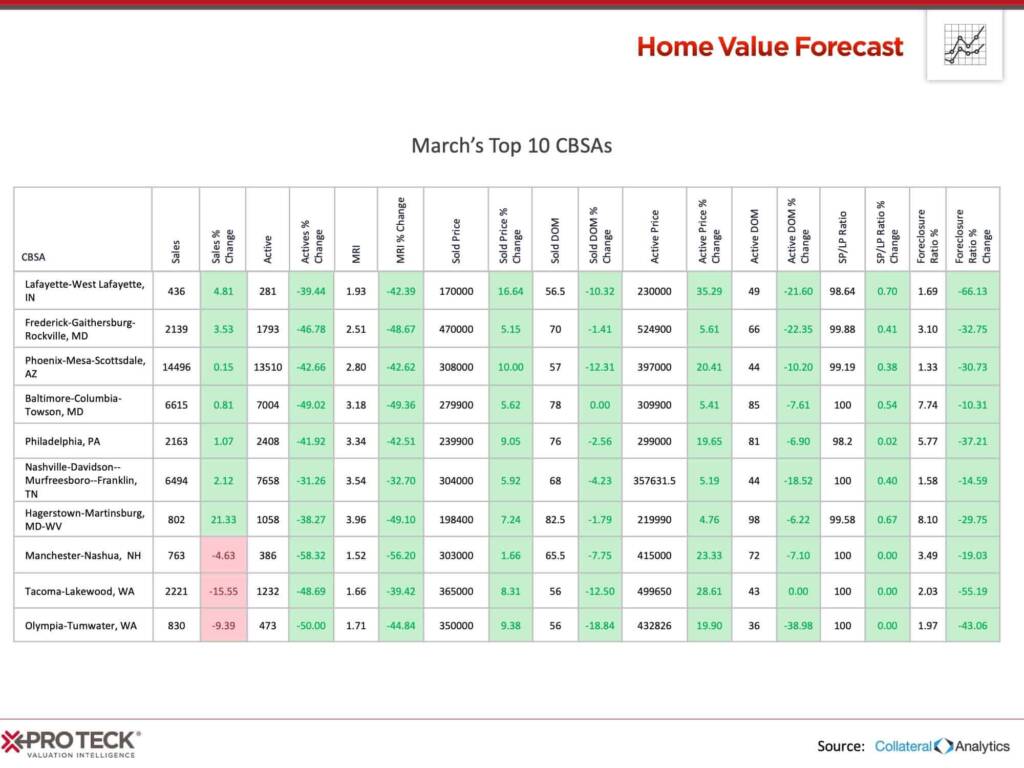
Baltimore-Columbia-Towson CBSA
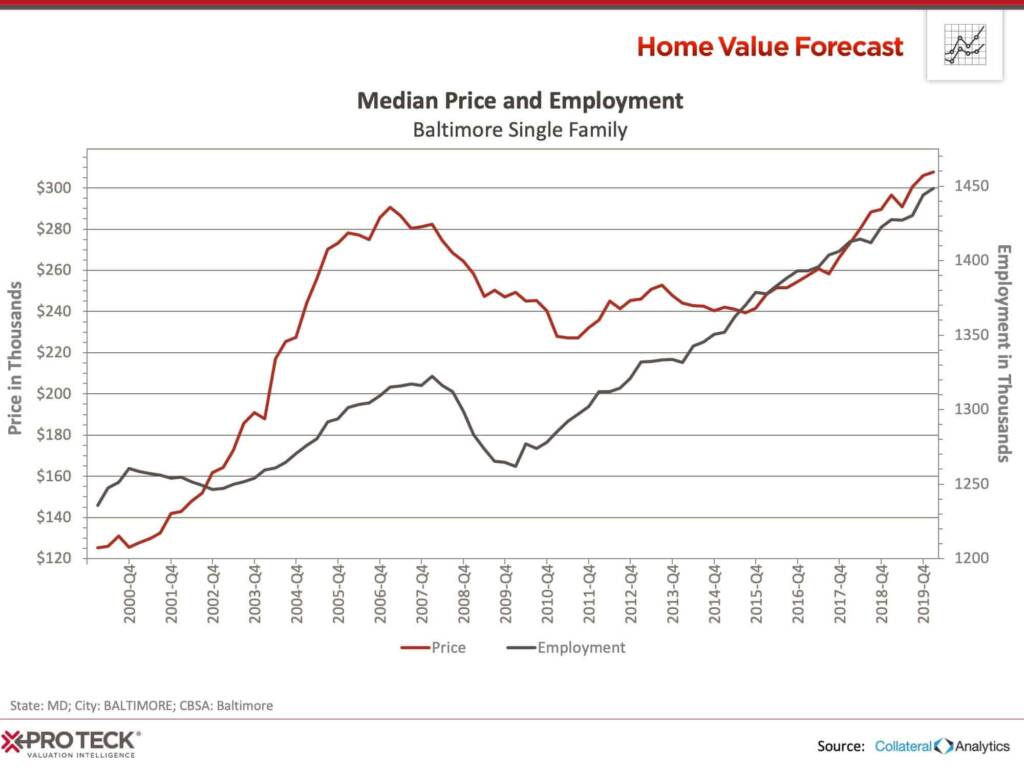
The Baltimore area has both a rich history and an unfortunate reputation. The city’s high crime rate, depicted in The Wire and other television shows, is what many think of first.
Fortunately, the city and surrounding area have so much more to offer than what’s portrayed on TV. World-class medical facilities, thriving business, educational, and hospitality industries, combined with affordable housing make the Baltimore metro area an attractive spot.
The Baltimore CBSA has added almost 200,000 jobs over the last decade, and average home prices have rebounded to new highs:
At the same time, household incomes have been on the upswing, up 33% from Q4, 2006. However, home prices are only up 6.6%, as a true rebound in home prices didn’t start until 2015:
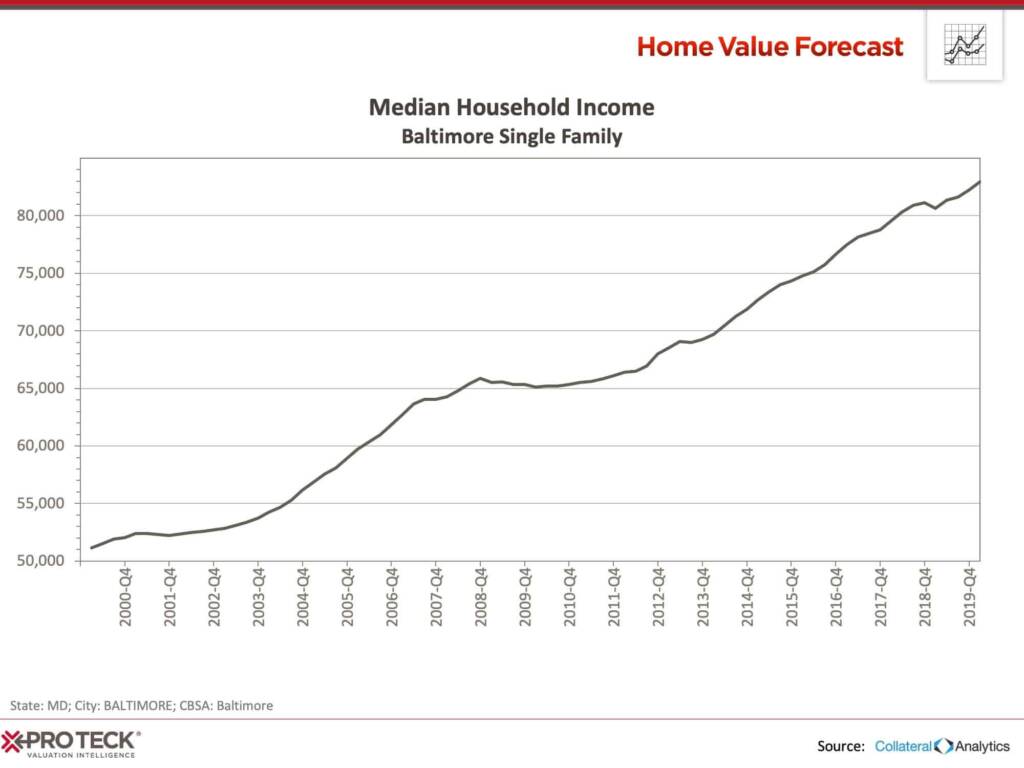
In recent years, affordability has remained strong:
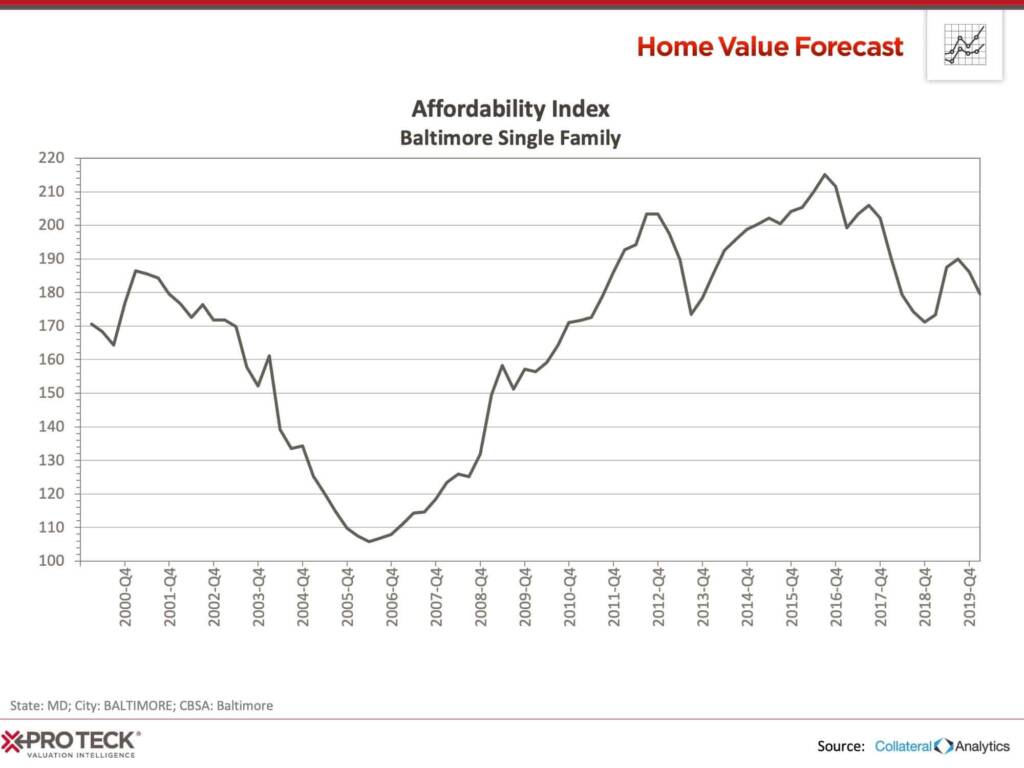
We often discuss affordability in our Home Value Forecasts. Our “Affordability Index” is calculated by looking at the ratio of median income for an area compared to the mortgage payment needed to purchase a median priced home. An index score above 100 signifies that a household earning the median income has more than enough income to afford the mortgage. Lower scores suggest more income is needed to cover mortgage expenses. The Collateral Analytics Affordability Index used by Home Value Forecast also looks at loan-to-value norms for a particular area to adjust for more affluent buyers usually putting more money down.
What does this mean for the Baltimore area? It means homes are affordable. With remote/virtual employment being the norm, we’ve seen a migration by people (and companies) into areas with higher affordability. This migration should translate into a healthy real estate market in the area for the foreseeable future.
ABOUT SVI’S MONTHLY HOUSING MARKET REPORT
The Home Value Forecast uses a ranking system that is purely objective and is based on directional trends of nine market indicators. Each indicator is given a score based on whether the trend is positive, negative or neutral for that series. For example, a declining trend in active listings would be positive, as would an increasing trend in average price. A composite score for each CBSA is calculated by summing the directional scores of each of its indicators. From the universe of the top 200 CBSAs, each month we highlight topics and trends in the real estate market.