Home Value Forecast
Eastward Expansion: Top 10 Hottest Markets Now Reach Coast to Coast
Each month, HVF’s Housing Market Report uses a number of leading real estate market-based indicators to report on activity in the single-family home markets in the top 200 metropolitan areas (CBSAs) in the U.S., and reports on the Top Ten.
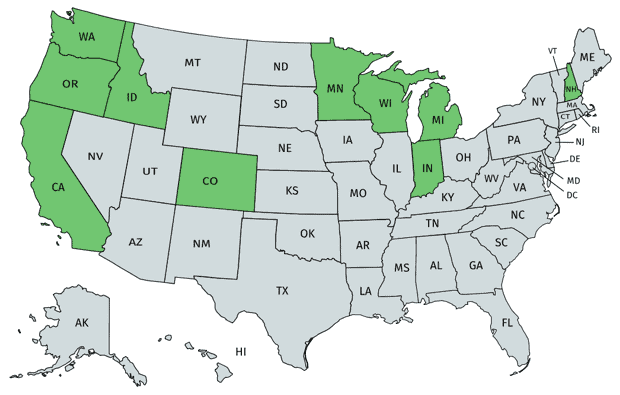
This month, our Top Ten markets span 10 states across the United States, a far cry from when California and Washington state used to dominate the list.
The numbers:
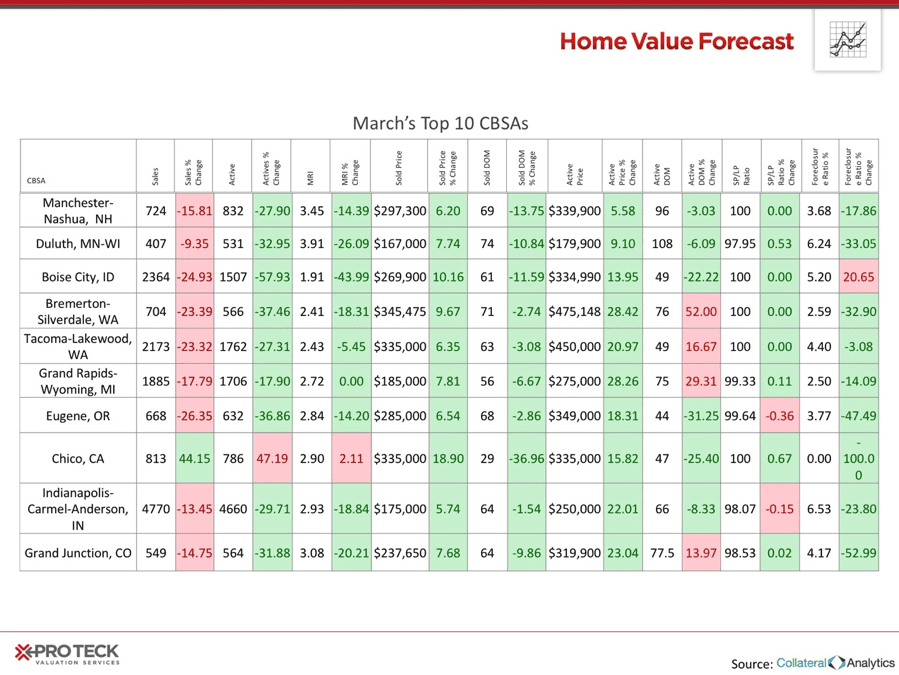
Our ranking system at HVF is purely objective and is based on directional trends. It’s not a listing of what markets are most expensive or most in need of inventory — it ranks market momentum at a specific point in time.
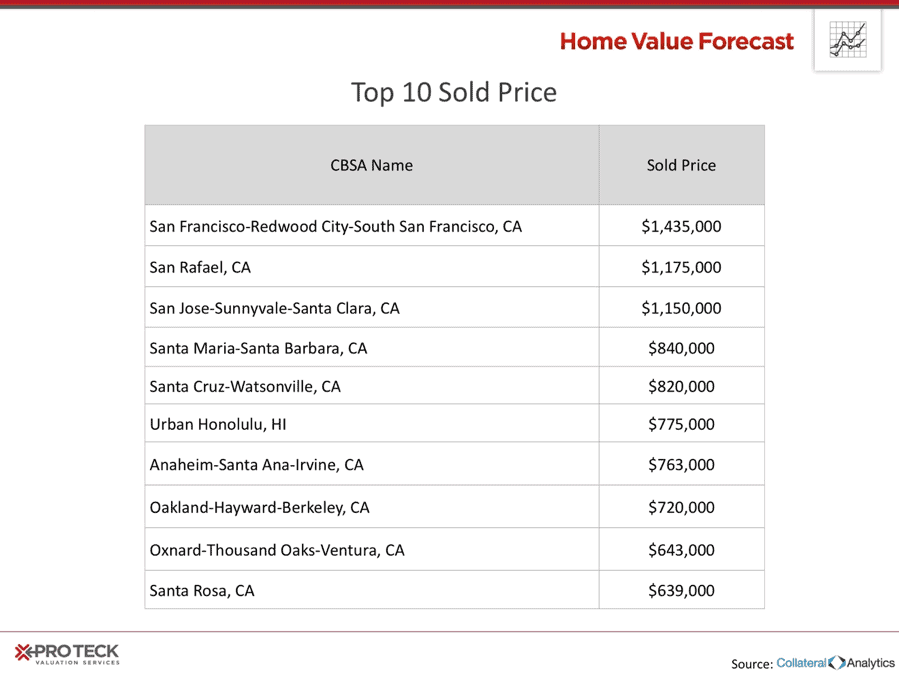
If we were to look at sold price and month’s remaining inventory (MRI) alone, many common regions would rise to the top.
Top 10 Sold Price:
Top 10 Lowest Months of Remaining Inventory (MRI):
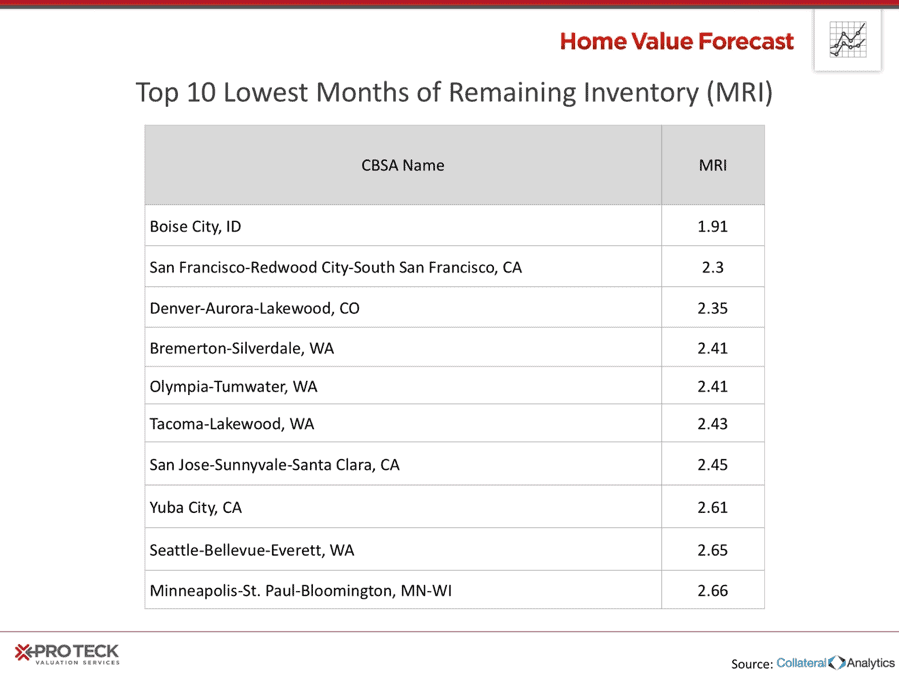
While these markets are still “hot” in many ways, their market momentum has slowed down.
Take Honolulu, HI for example. They are still in the Top 10 for most expensive CBSAs, but recent trends show a slowdown in appreciation, and a downturn if you look at condo trends.
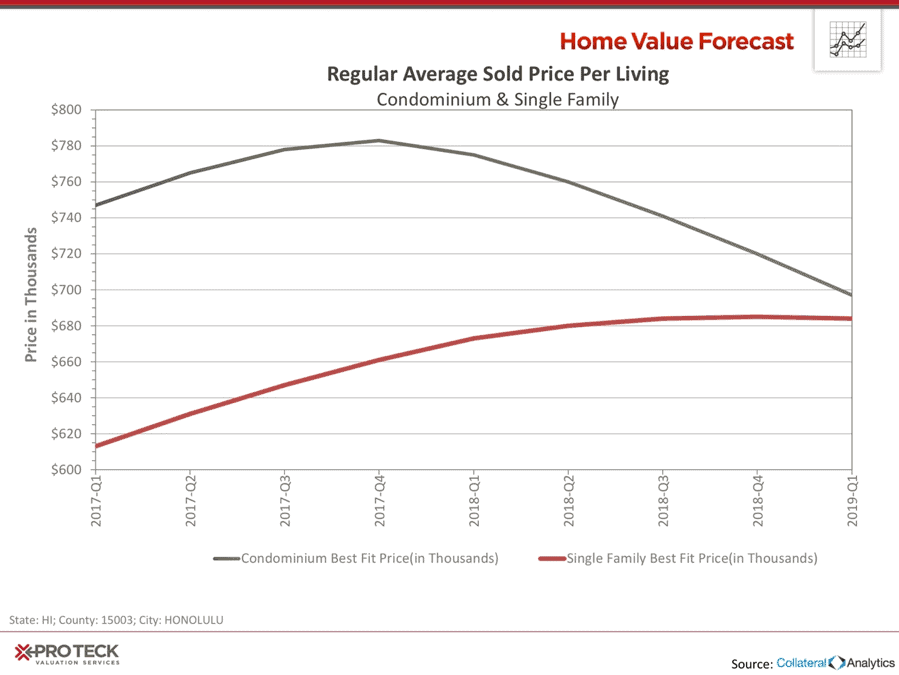
It will be interesting to see if this momentum continues to carry across these regions and the country as we head into Spring, a notoriously busy time in the real estate industry.
Interested in learning more about the top metros featured in this month’s market report? Contact us for more in-depth information on each CBSA listed in this month’s report.
ABOUT SVI’S MONTHLY HOUSING MARKET REPORT
The Home Value Forecast uses a ranking system that is purely objective and is based on directional trends of nine market indicators. Each indicator is given a score based on whether the trend is positive, negative or neutral for that series. For example, a declining trend in active listings would be positive, as would an increasing trend in average price. A composite score for each CBSA is calculated by summing the directional scores of each of its indicators. From the universe of the top 200 CBSAs, each month we highlight topics and trends in the real estate market.