Home Value Forecast
Home Value Forecast: A Change of Pace Is Hitting the Housing Market
Each month, Home Value Forecast uses a number of leading real estate market-based indicators to report on activity in the single-family home markets in the top 200+ metropolitan areas (CBSAs) in the U.S., and reports on the Top Ten.
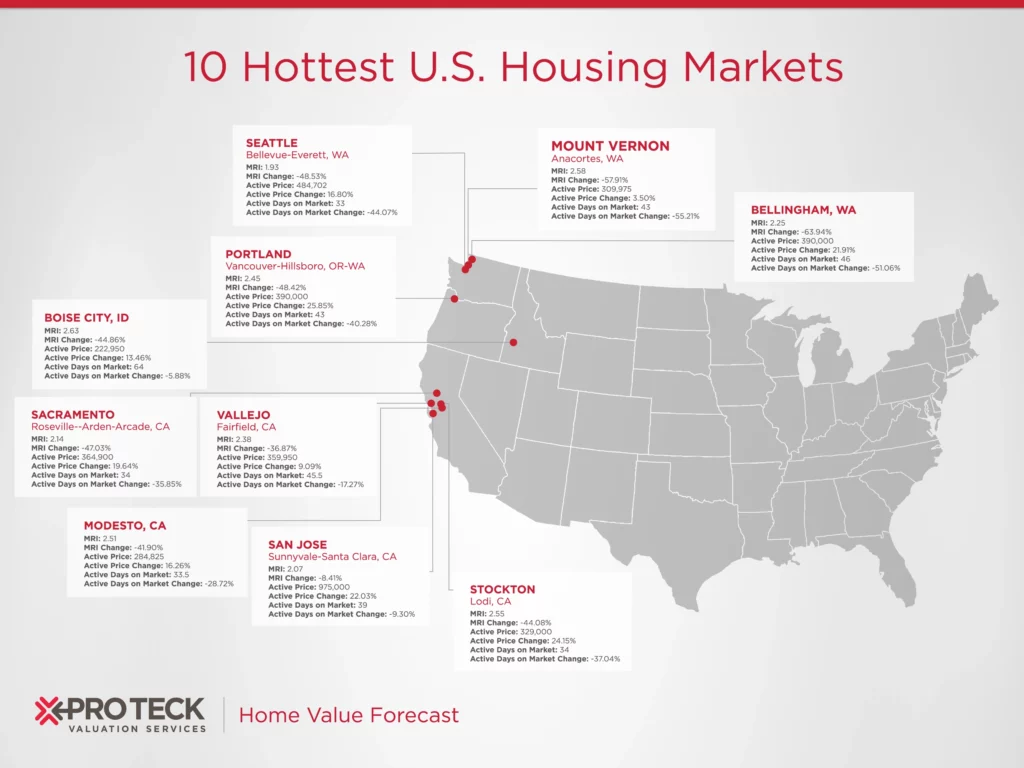
The Top Ten
Our Top Ten ranking system at HVF is purely objective and is based on directional trends. It’s not a listing of what markets are most expensive or most in need of inventory — it ranks market momentum at a specific point in time.
This month’s Top 10 metros span the nation, and mostly include metros we haven’t traditionally seen before:
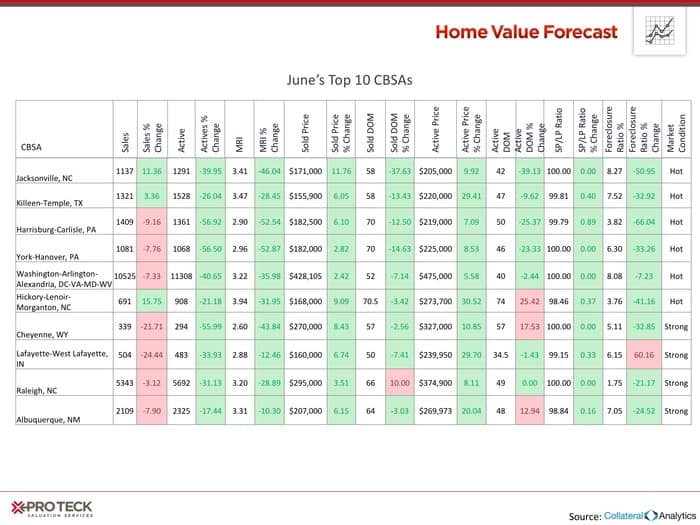
Based on our scoring system, each metro is classified into seven market conditions: Hot, Strong, Good, Normal, Soft, Weak, and Distressed. We’ve added the Market Condition ranking to our Top 10, and have outlined the distribution of these market conditions in the metros we track below.
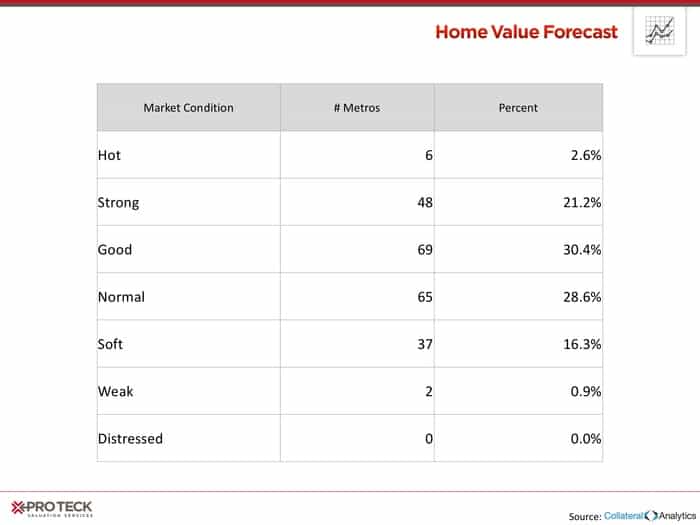
The national housing market is still strong, but the pace of change has slowed. 75% of the metros are in the “Good, Normal, Soft” middle of our scoring system, meaning a more balanced market.
High Flyers
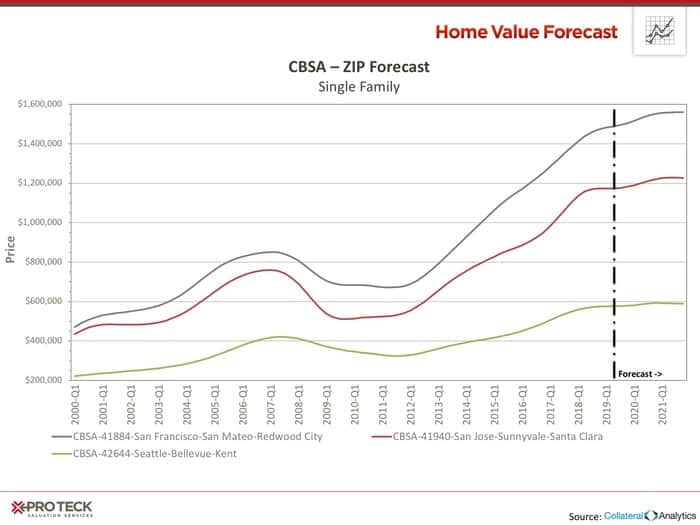
What’s happening is that the pace in change in California and Washington state, metros that consistently landed on our Top 10, has slowed. Let’s take a look at three top metros, and where they stand today.
San Francisco, San Jose and Seattle are some of the most expensive metros in the nation, but the pace of change has slowed, landing all three in our “Normal” market condition ranking.
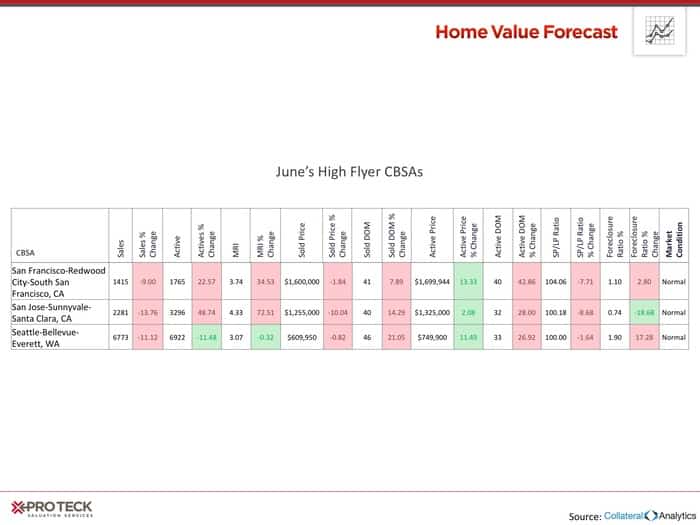
Flattening in the price curves can be seen over the last year, as is the forecast.
Interested in learning more about the top metros featured in this month’s market report? Contact SVI for more in-depth information on each CBSA listed in this month’s report.
About SVI’s Monthly Housing Market Report
The Home Value Forecast uses a ranking system that is purely objective and is based on directional trends of nine market indicators. Each indicator is given a score based on whether the trend is positive, negative or neutral for that series. For example, a declining trend in active listings would be positive, as would an increasing trend in average price. A composite score for each CBSA is calculated by summing the directional scores of each of its indicators. From the universe of the top 200 CBSAs, each month we highlight topics and trends in the real estate market.