Home Value Forecast
Home Value Forecast: Eastward Expansion? Hot Markets Shift Away from the West
Each month, Home Value Forecast uses a number of leading real estate market-based indicators to report on activity in the single-family home markets in the top 200+ metropolitan areas (CBSAs) in the U.S., and reports on the Top Ten.
The Top Ten
The Home Value Forecast Top Ten ranking system is purely objective and is based on directional trends. It’s not a listing of what markets are most expensive or most in need of inventory — it ranks market momentum at a specific point in time.
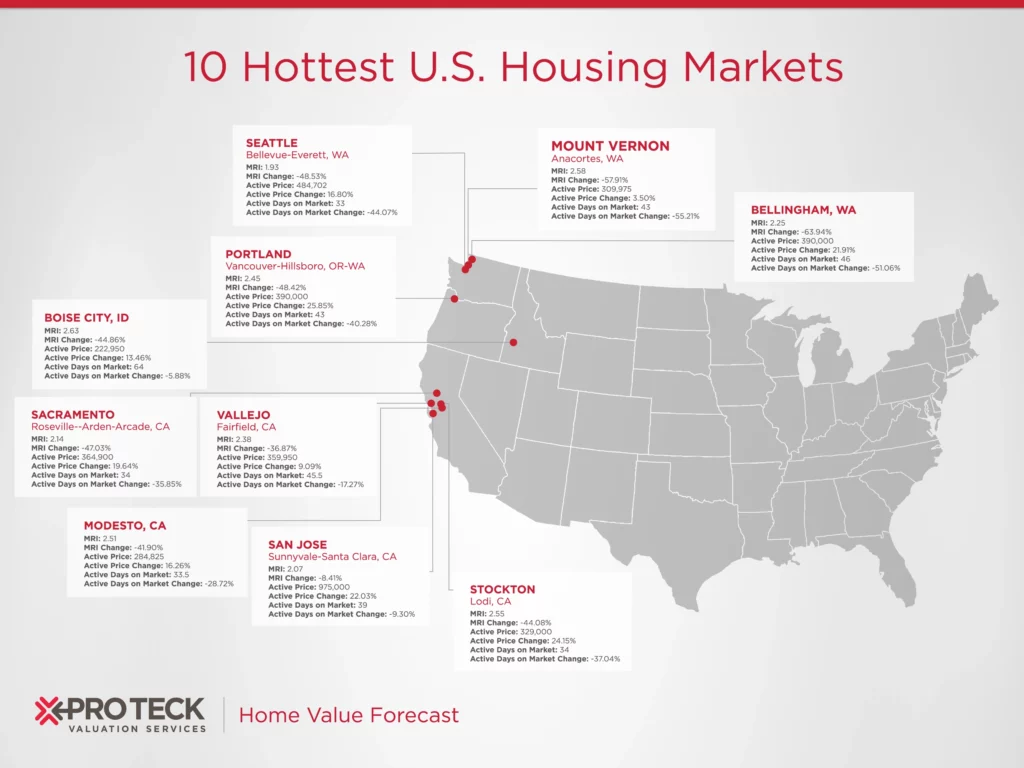
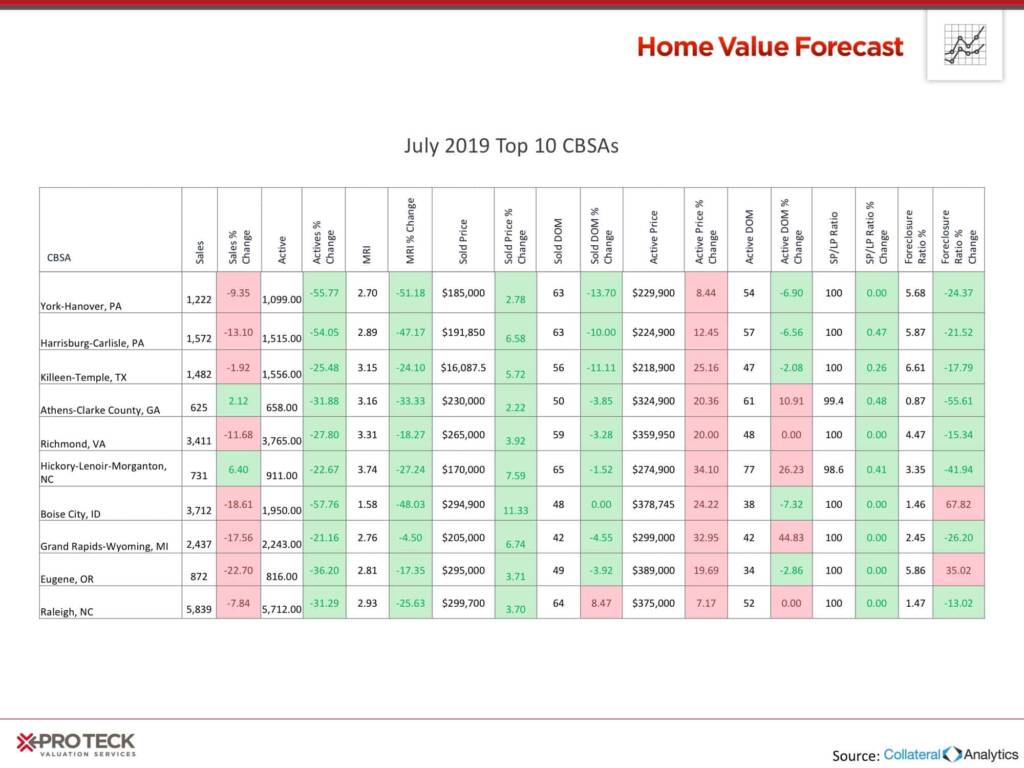
This month’s Top Ten metros show a further shift to the East, with Killeen, TX, Boise City, ID, and Eugene, OR, being our only western Top Ten metros:
Last year at this time, all ten metros were from the West (including Boise and Eugene):
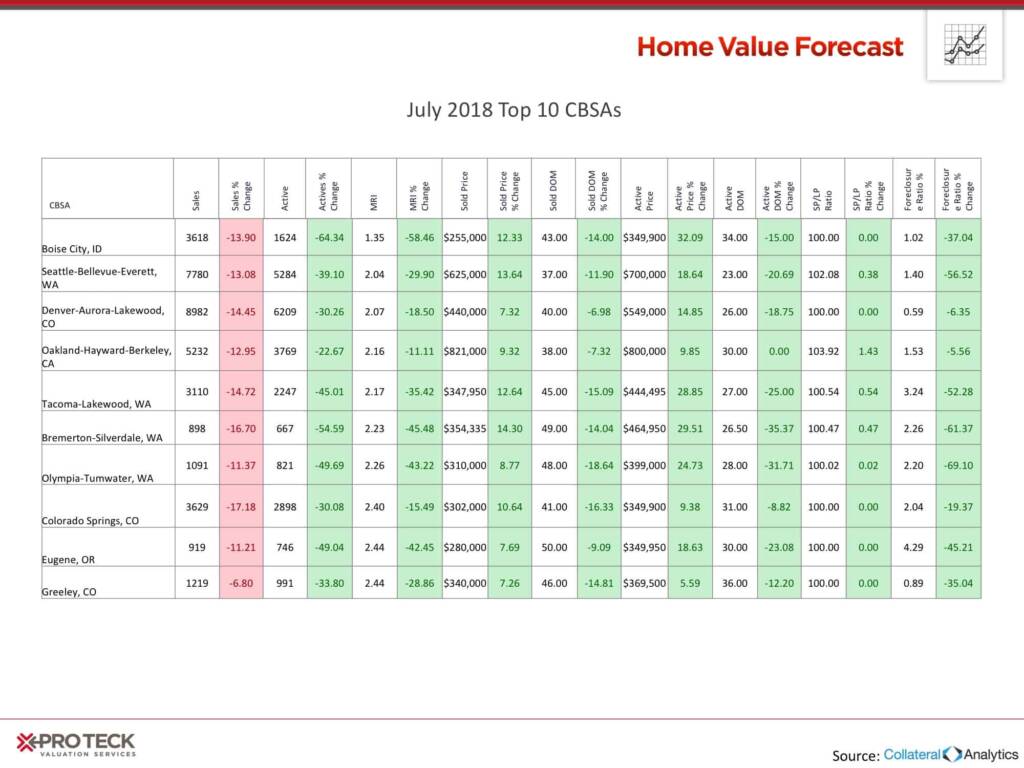
After years of rapid price appreciation, it finally looks like things are slowing down in California, Colorado, Washington state and other formerly hot western markets.
Raleigh CBSA
Raleigh, NC, lands again in our Top Ten, and for good reason. The area is known for both high-tech and banking, and its weather and affordability attract those looking for a change. We wrote about the Raleigh/Durham/Chapel Hill area booming two years ago, and many of those reasons for growth then still stand true today.
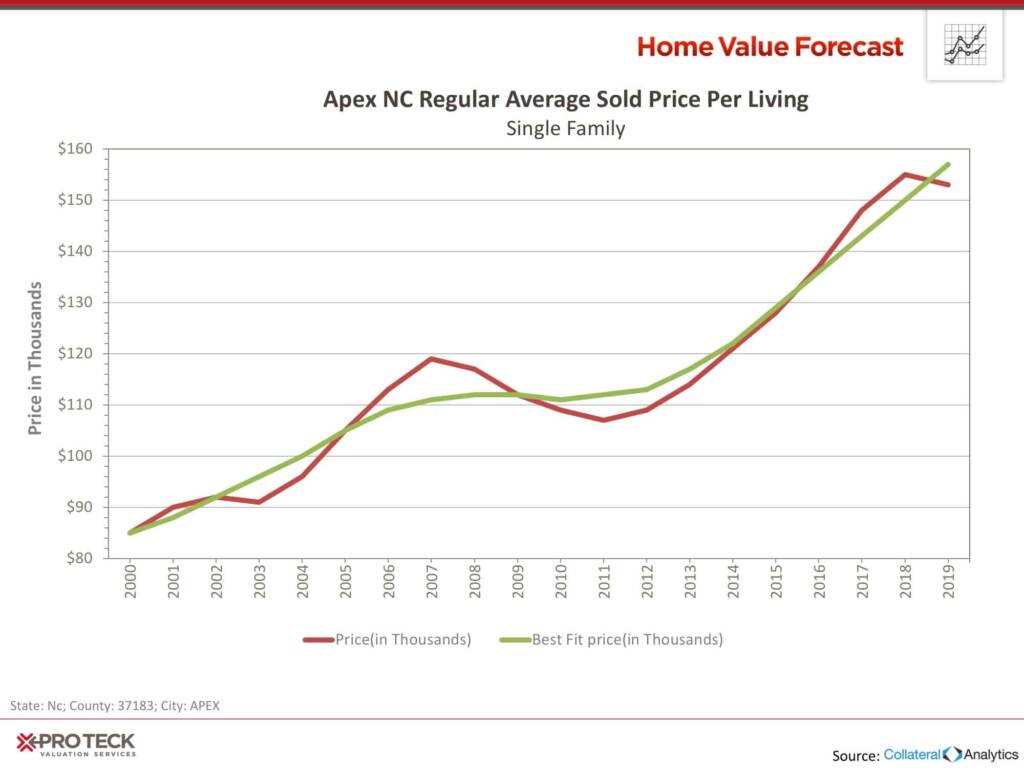
Apex, NC, 12 miles southwest of Raleigh, has experienced unprecedented growth over the last 30 years, from less than 5,000 residences in 1990 to over 57,000 today. With that growth has come some growing pains, as outlined in a recent Wall Street Journal article.
While the roads, schools and other community amenities have felt the strain of growth, it hasn’t been reflected in a slowdown in home price appreciation.
Other eastern CBSAs cracking the Top Ten this month include two from Pennsylvania, one each from Georgia and Virginia, and a second one from North Carolina.
Interested in learning more about the top metros featured in this month’s market report? Contact SVI for more in-depth information on each CBSA listed in this month’s report.
About SVI’s Monthly Housing Market Report
The Home Value Forecast uses a ranking system that is purely objective and is based on directional trends of nine market indicators. Each indicator is given a score based on whether the trend is positive, negative or neutral for that series. For example, a declining trend in active listings would be positive, as would an increasing trend in average price. A composite score for each CBSA is calculated by summing the directional scores of each of its indicators. From the universe of the top 200 CBSAs, each month we highlight topics and trends in the real estate market.