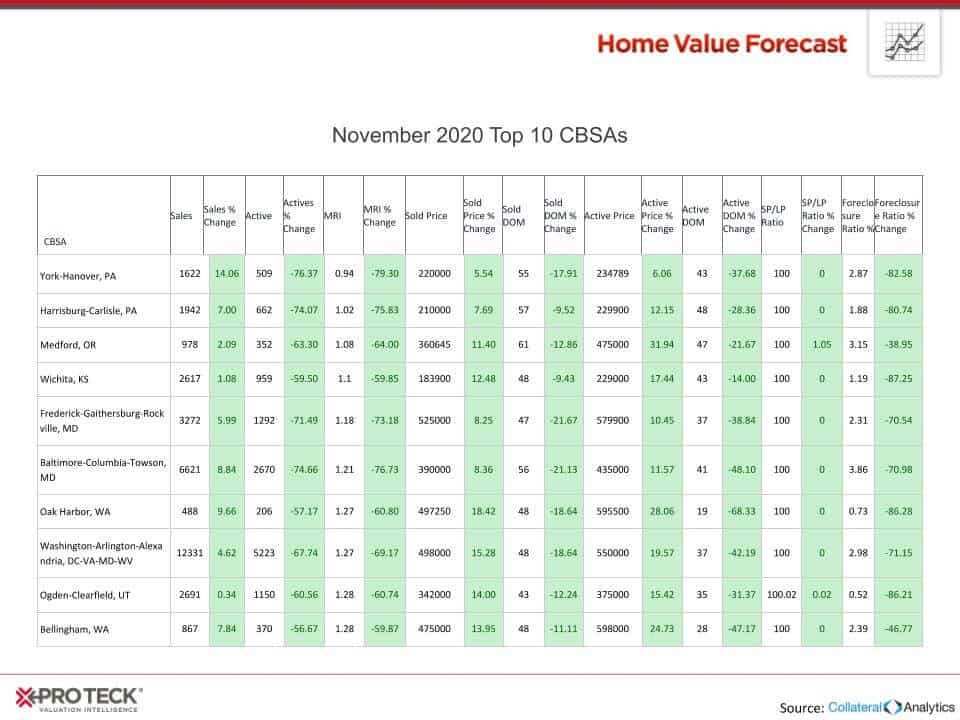
Each month, Home Value Forecast uses a number of leading real estate market-based indicators to report on activity in the single-family home markets in the top 200+ metropolitan areas (CBSAs) in the U.S., and reports on the Top 10.
THE TOP 10
The Home Value Forecast Top 10 ranking system is purely objective and is based on directional trends. It’s not a listing of what markets are most expensive or most in need of inventory – it ranks market momentum at a specific point in time.
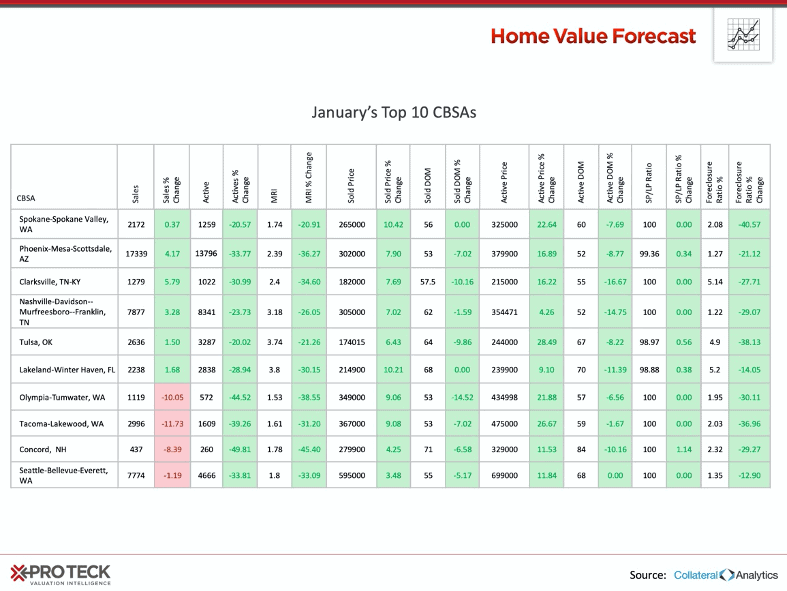
This month, Washington state is well represented with four metros in our Top 10.
Washington State
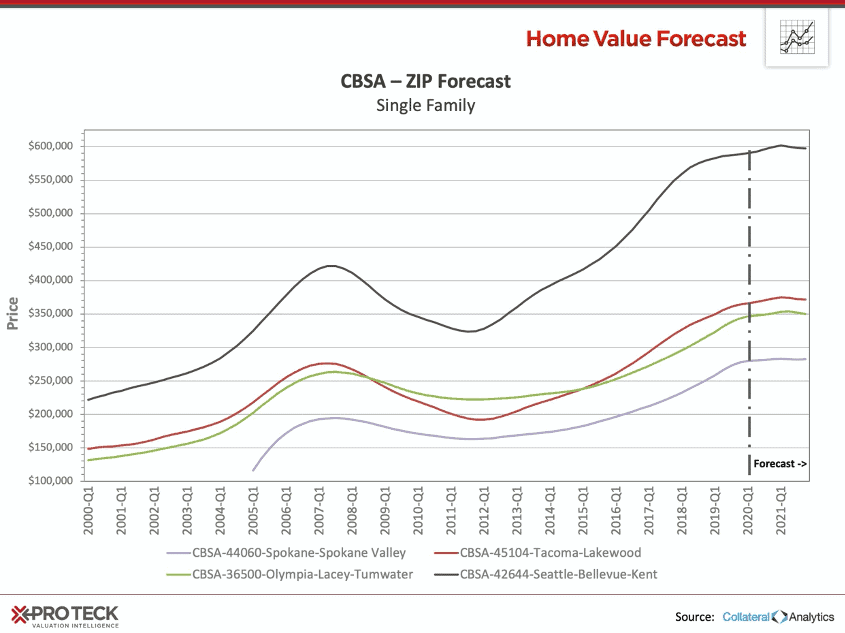
Seattle, Tacoma and Olympia, 60 miles North to South along Puget Sound have growing employment fueled by coffee, technology and, of course, Amazon. Median home prices are $595,000, $367,000 and $349,000 respectively.
One might ask why not commute to Seattle from Olympia, 60ish miles doesn’t seem so bad for some financial flexibility. Problem is, the commute can be up to 3 hours or more during rush hour – even from Tacoma it can be over 2 hours. With water, inlets and bays making finding a direct route nearly impossible, being close to your work address is a necessity – that is, if you have to go to an office.
Spokane, on the other hand, has a median home price right now of $265,000, less than half of the Seattle CBSA.
4 and a half hours and 280 miles east of Seattle, Spokane had a reputation as a sleepy town close to the Idaho border. Between mountain ranges, Spokane offers fewer rainy days, many outdoor sports and now a hip downtown and art scene. People from the Seattle areas are taking notice.
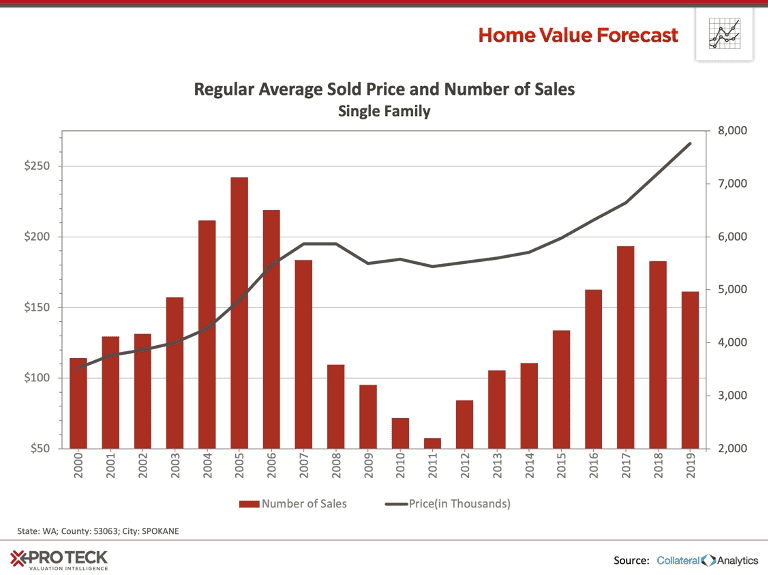
A recent study showed that a large majority of people moving to Spokane are coming from the Seattle/Tacoma area, and with more and more remote work options available, it’s no wonder people appreciate the more affordable prices. The problem now, however, is there’s not enough housing supply.
Today, Months of Remaining Inventory (MRI) for Spokane is at 1.74 months, well below the 6-8 month “balanced market” norm. Homes sized for a family (2,000 – 2,499 square feet) had the lowest MRI of 0.84, just a little more than three weeks.
With strong supply and limited inventory, prices are sure to continue to climb.

ABOUT STEWART VALUATION’S MONTHLY HOUSING MARKET REPORT
The Home Value Forecast uses a ranking system that is purely objective and is based on directional trends of nine market indicators. Each indicator is given a score based on whether the trend is positive, negative or neutral for that series. For example, a declining trend in active listings would be positive, as would an increasing trend in average price. A composite score for each CBSA is calculated by summing the directional scores of each of its indicators. From the universe of the top 200 CBSAs, each month we highlight topics and trends in the real estate market.
