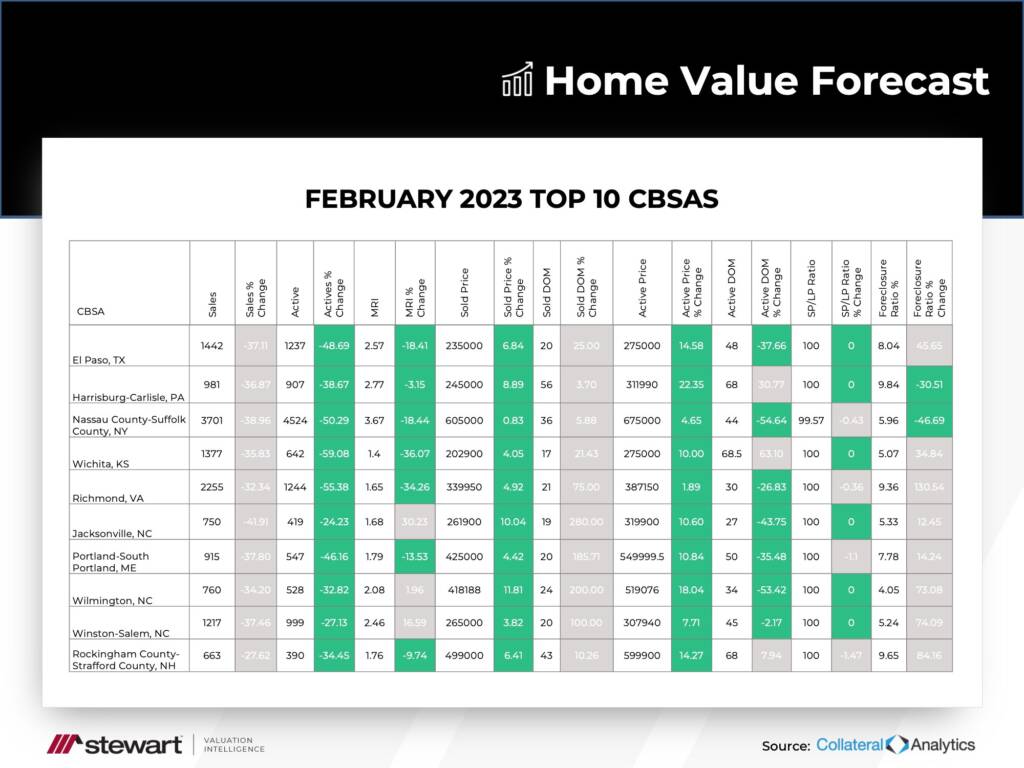
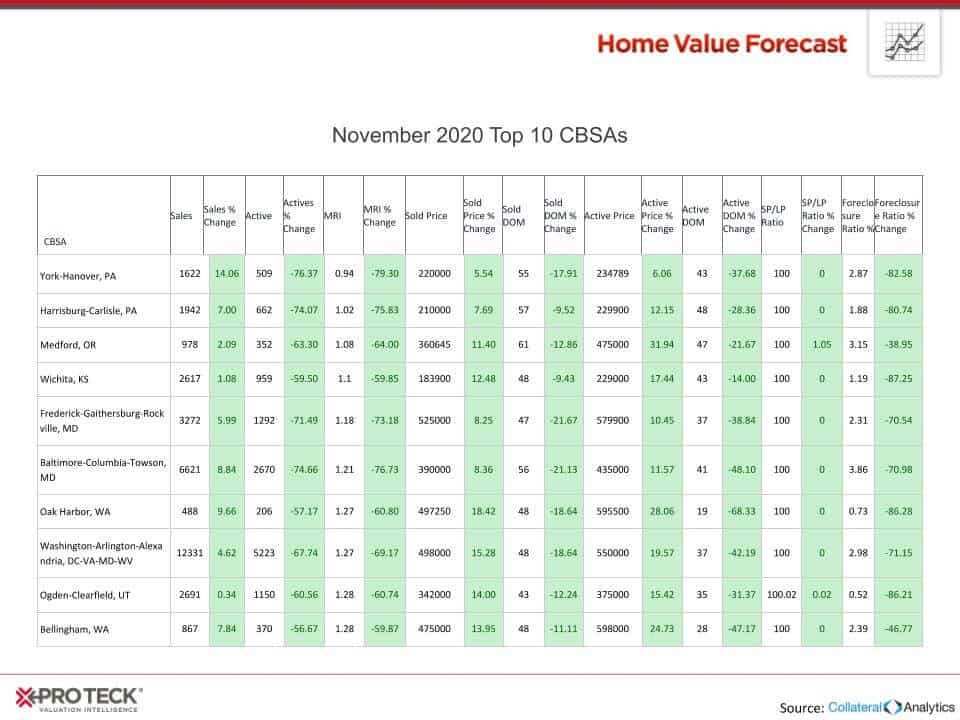
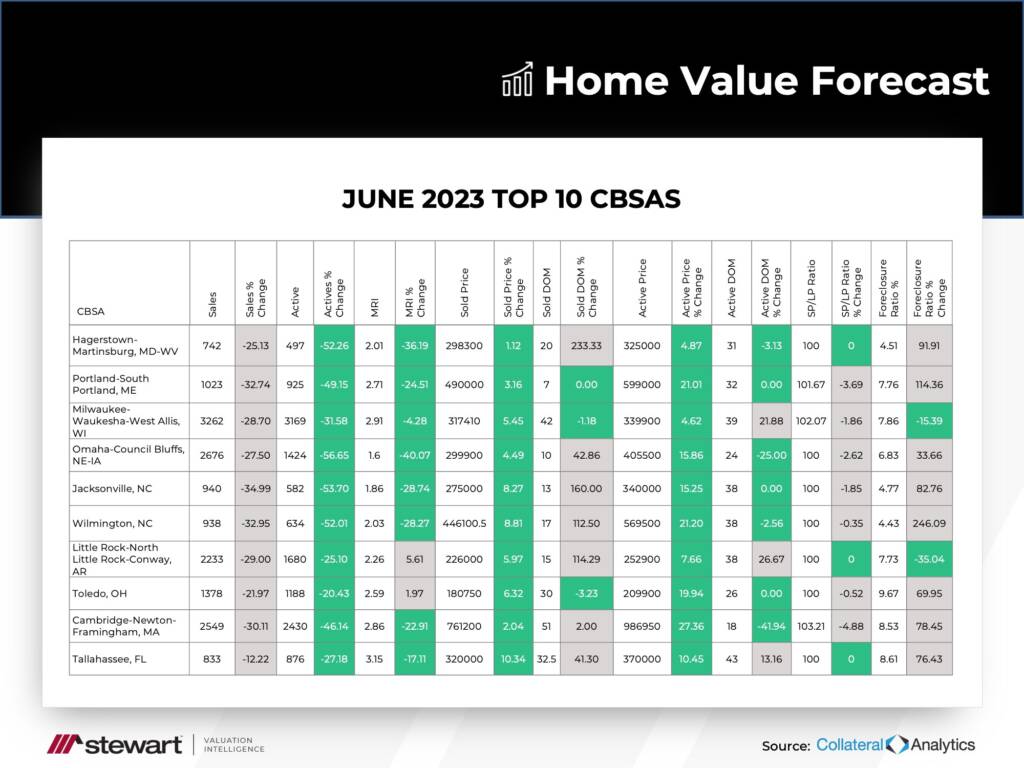
Each month, Home Value Forecast uses a number of leading real estate market-based indicators to monitor single-family home market activity in the nation’s top 200+ metropolitan areas (CBSAs) and report on the Top 10.
THE TOP 10
The Home Value Forecast Top 10 Hottest Housing Markets ranking system is purely objective and is based on directional trends over the past eight quarters. It’s not a listing of what markets are most expensive or most in need of inventory; it ranks market momentum at a specific point in time.
This month, eight of the top 10 are from the East Coast, with three North Carolina metros making the Top 10.

Interest Rate Impact
Hikes in interest rates, hitting a high of 7.37% in November 2022, have impacted the housing market. Eight experts were recently asked what they thought rates would average in 2023, and predictions varied from 5.2% to 7.4%. Wherever the average number ends up, it has severely affected affordability.
Wilmington, NC
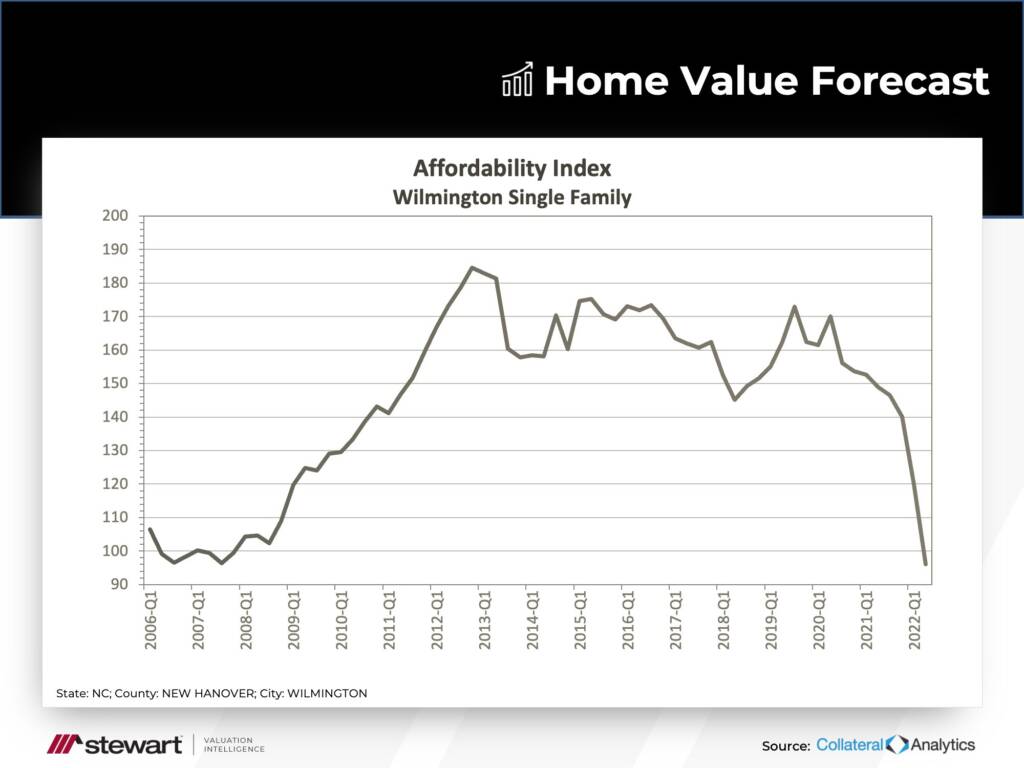
Wilmington, NC ended up on our top 10 this month, with a solid 11.81% year over year price increase. Affordability, however, has taken a nosedive over the last 12 months, correlating with interest rate increases.
Affordability is derived by looking at the median income for a particular area as a ratio to the mortgage payment needed to purchase a median priced home. An index score above 100 signifies that a household earning the median income has enough income to afford the mortgage. Lower scores suggest more income is needed to cover mortgage expenses. The Collateral Analytics Affordability Index used by Home Value Forecast also looks at loan-to-value norms for a particular area to adjust for more affluent buyers usually putting more money down.
In the past year, Wilmington’s affordability has fallen below where it was in the last housing bubble. Subsequently, our forecast estimates modest price increases until mortgage rates fall.

ABOUT STEWART VALUATION INTELLIGENCE’S MONTHLY HOUSING MARKET REPORT
The Home Value Forecast uses a ranking system that is purely objective and is based on directional trends of market indicators. Each indicator is given a score based on whether the trend is positive, negative or neutral for that series. For example, a declining trend in active listings would be positive, as would an increasing trend in average price. A composite score for each CBSA is calculated by summing the directional scores of each of its indicators.

