Home Value Forecast
Home Value Forecast: Heading Back to Nashville, TN
Each month, Home Value Forecast uses a number of leading real estate market-based indicators to report on activity in the single-family home markets in the top 200+ metropolitan areas (CBSAs) in the U.S., and reports on the Top 10.
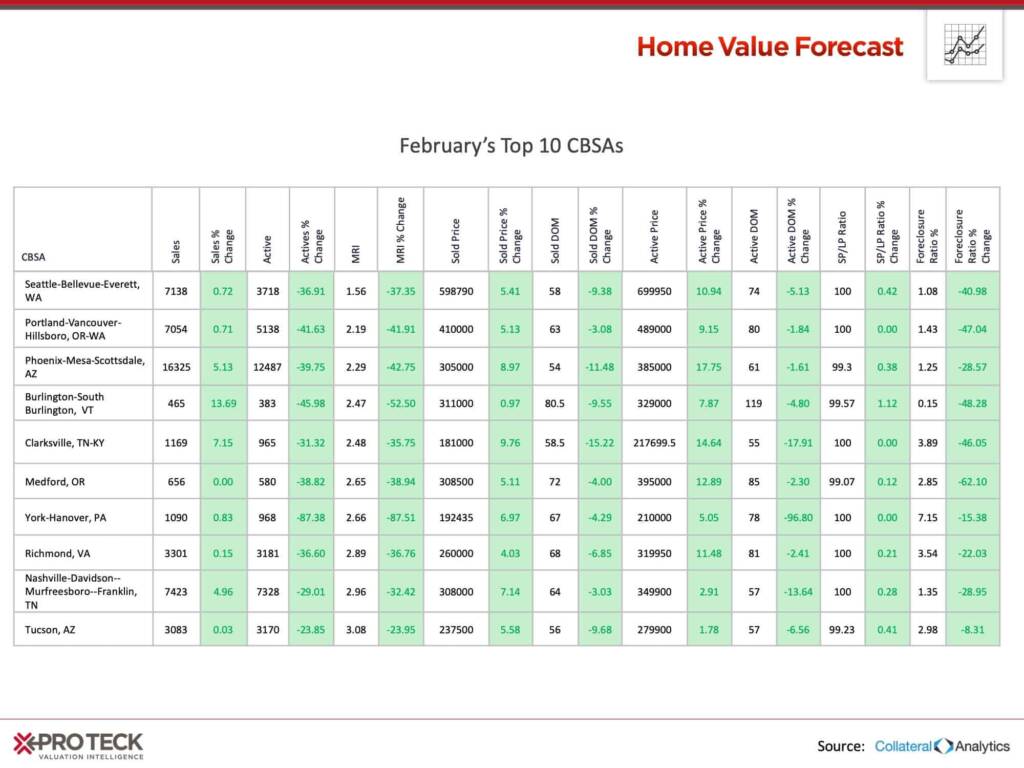
THE TOP 10
The Home Value Forecast Top 10 ranking system is purely objective and is based on directional trends. It’s not a listing of what markets are most expensive or most in need of inventory – it ranks market momentum at a specific point in time.
This month’s Top 10 has the Pacific Northwest still well represented, but there are CBSAs from around the country:
Let’s Head Back to Nashville
Nashville, Tennessee made the Top 10 this month, as it did three years ago when we devoted a post to the good and bad side of recovery. Nashville’s economy, powered by the music/tourism, health care, education and fashion industries was rated the 30th best place for business and careers in Forbes’ 2016 ranking. For 2019 its ranking moved up to number 15 and its ranking isn’t the only thing on the upswing.
In our story three years ago, home prices-per-square foot were up 50% above pre-crash highs, and today prices are up 96%. Also, prices are up 109% in the last eight years from the city’s post-crash low (Q4, 2011).
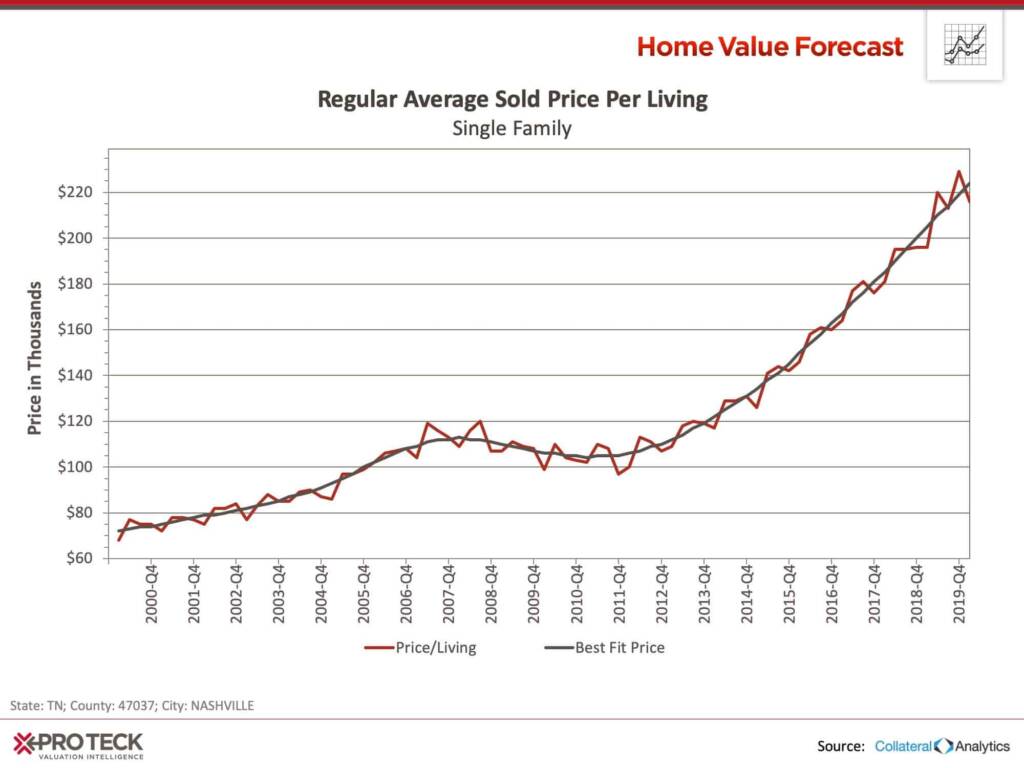
Appreciation on an average sold price-per-square-foot of living level has been up 10% per year over the last seven years.
Looking at the trend by average sold price shows a similar story, with average sold price up 76% the past decade:
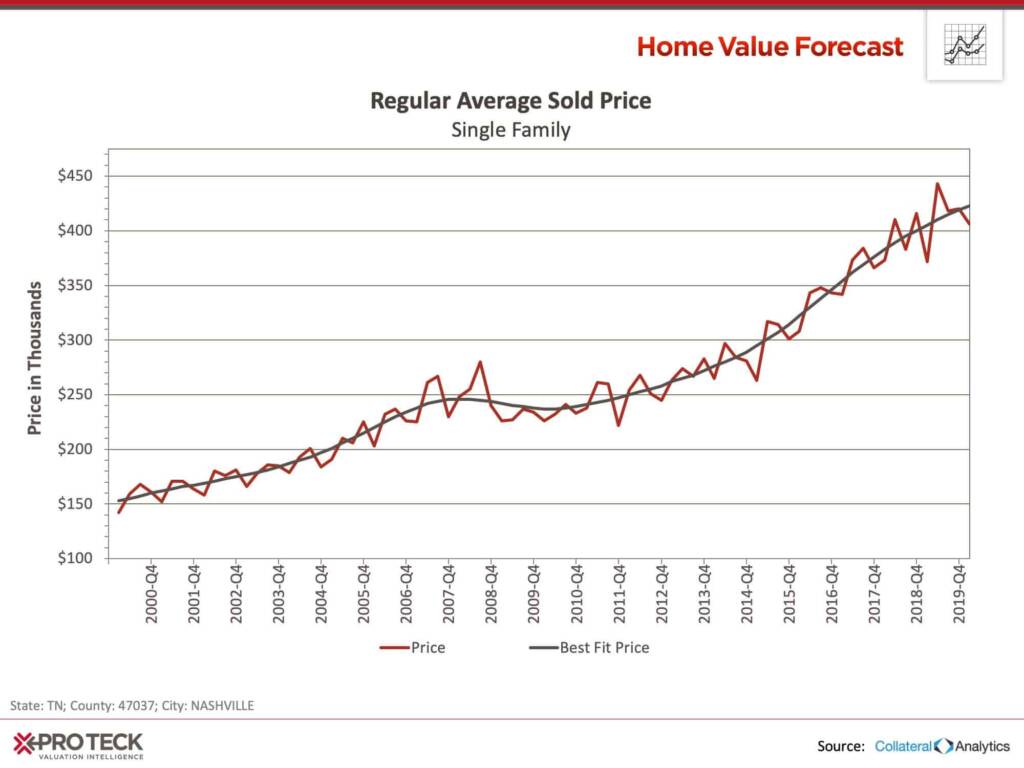
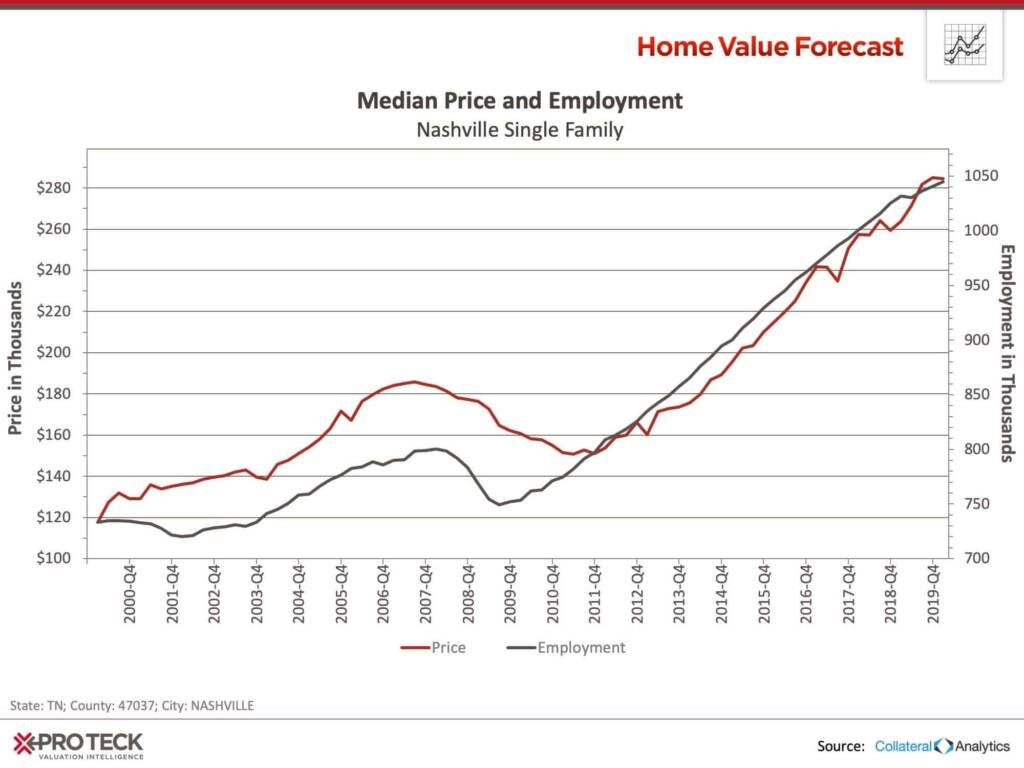
This combination of population growth and job creation has insulated Nashville from the downturn – and these trends don’t look to be reversing anytime soon.
A Noticeable Lack of Family Homes
Looking at Months of Remaining Inventory (MRI) by number of bedrooms shows how tight the market is for a typical family home with two to four bedrooms.
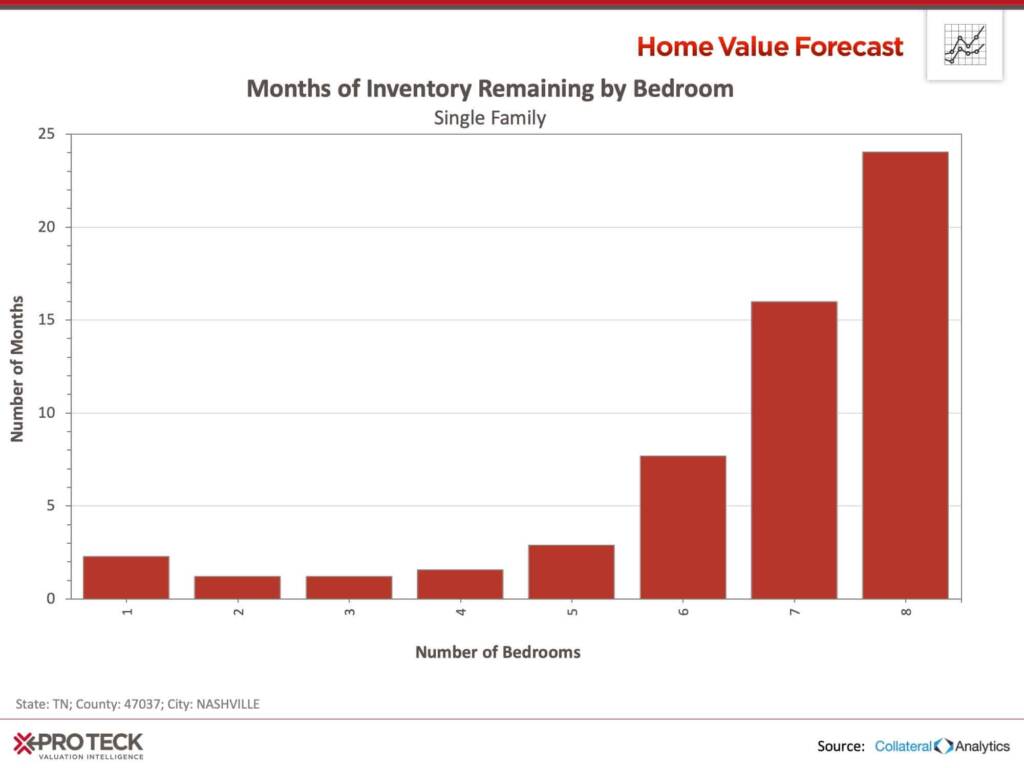
MRI) for two-to-four bedroom homes are 1.2, 1.2 and 1.5 months respectively, or five to six weeks, far below a balanced market, which averages six months MRI.
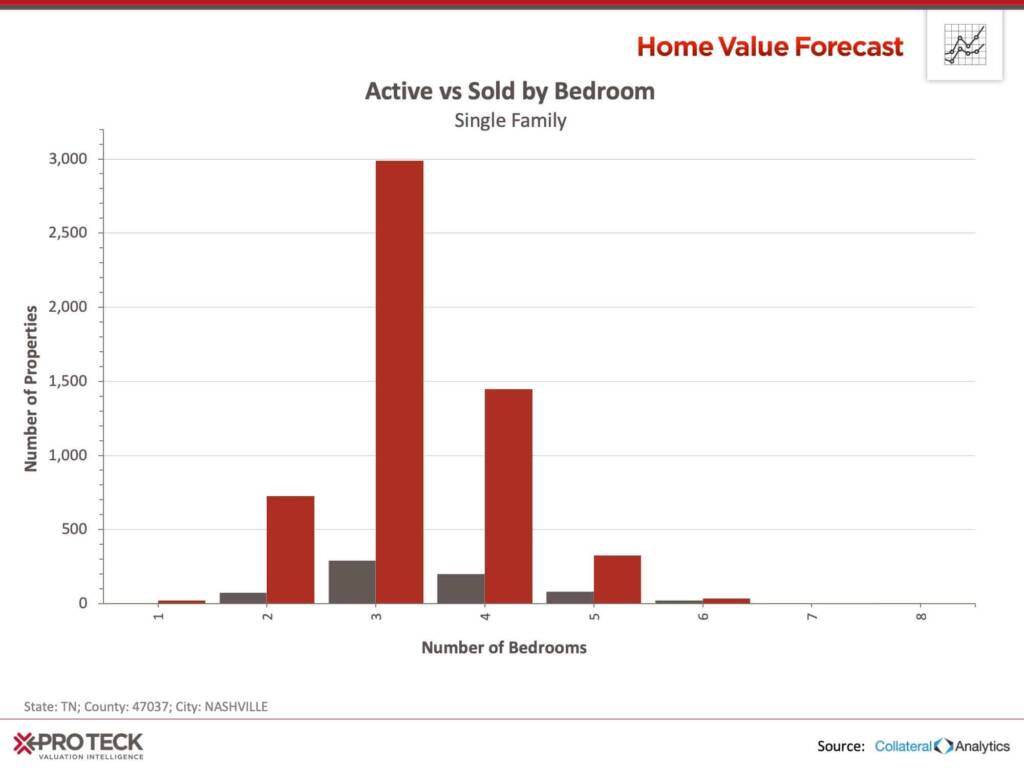
Looking at sales in the last 12 months of three-bedroom homes versus inventory on the market shows just how tight the market is.
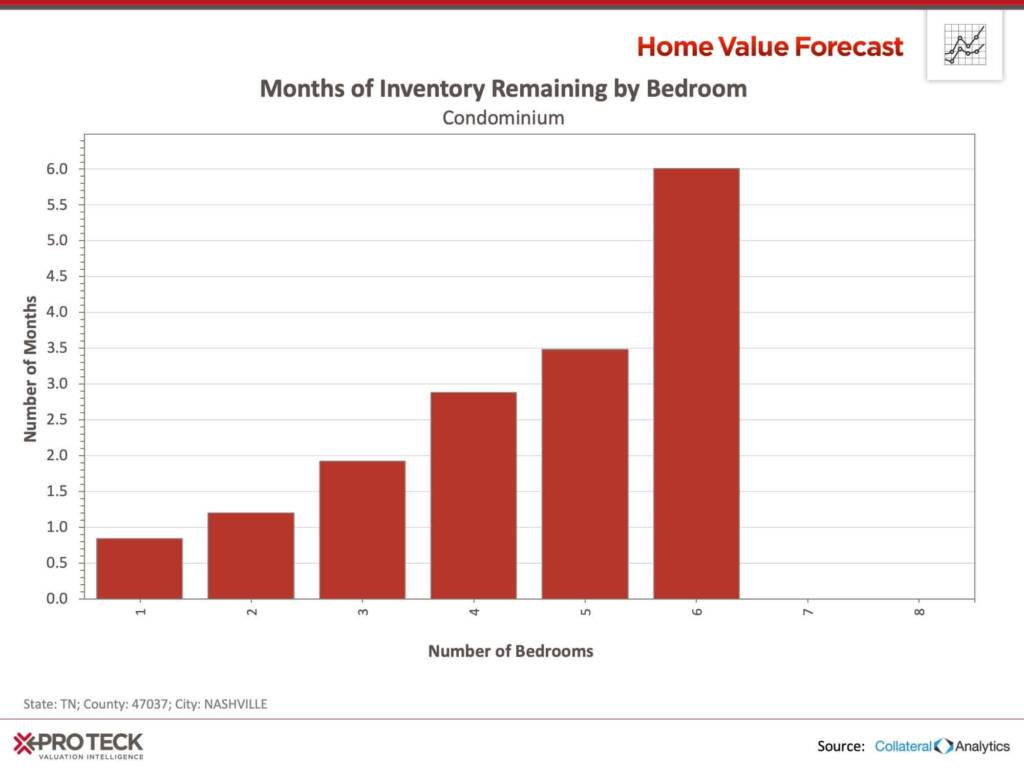
The majority of construction in Nashville lately has been to build condos. While still a tight market, there’s more inventory available for a three- or four-bedroom condo.
The city’s 2019 Housing Strategy initiative outlined future steps to increase quantity and quality of affordable housing stock across Nashville, deconcentrate poverty, and provide opportunities and services to residents. We will check-in on progress in three years or less.
ABOUT SVI’S MONTHLY HOUSING MARKET REPORT
The Home Value Forecast uses a ranking system that is purely objective and is based on directional trends of nine market indicators. Each indicator is given a score based on whether the trend is positive, negative or neutral for that series. For example, a declining trend in active listings would be positive, as would an increasing trend in average price. A composite score for each CBSA is calculated by summing the directional scores of each of its indicators. From the universe of the top 200 CBSAs, each month we highlight topics and trends in the real estate market.
