Home Value Forecast
Home Value Forecast: Nashville’s Housing Market Shows Good and Bad Side of Recovery
Nashville, Tennessee made Home Value Forecast’s Top Ten this month, and for good reason. Nashville’s economy, powered by the music/tourism, health care, education and fashion industries was rated the 30th best place for business and careers in Forbes’ 2016 ranking, and eighth for job growth.
From 2010 to 2015, the Nashville metro area’s population grew by 9.2 percent. As a result, this influx of new families has led to a rapid increase in home prices. From a price-per-square foot of living space perspective, home prices are 50 percent above pre-crash highs.
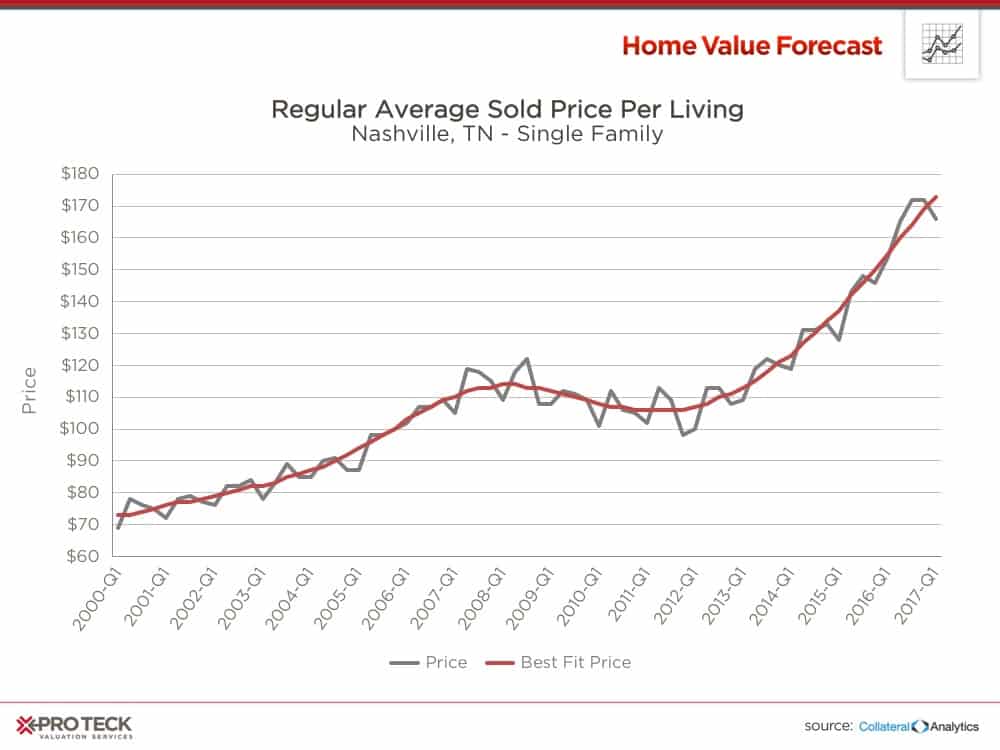
Unlike similar metros across the country, Nashville didn’t experience drastic price reductions post-crash, only losing 6 percent of value before the last four years of impressive appreciation.
Looking at the trend by average sold price shows a similar story:
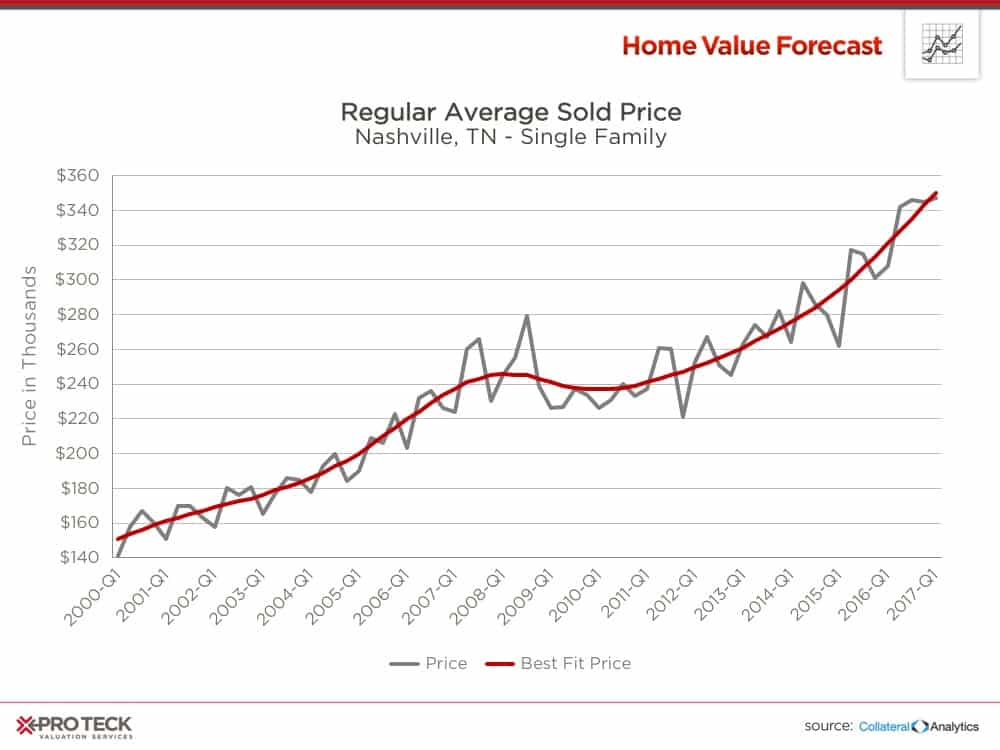
This combination of population growth and job creation has insulated Nashville from the downturn – limited inventory also played a part.
The Downside of Recovery
As we discussed last month, the drop in housing starts post-crisis has made housing inventory scarce. The following chart takes a closer look at what’s happening in Nashville:
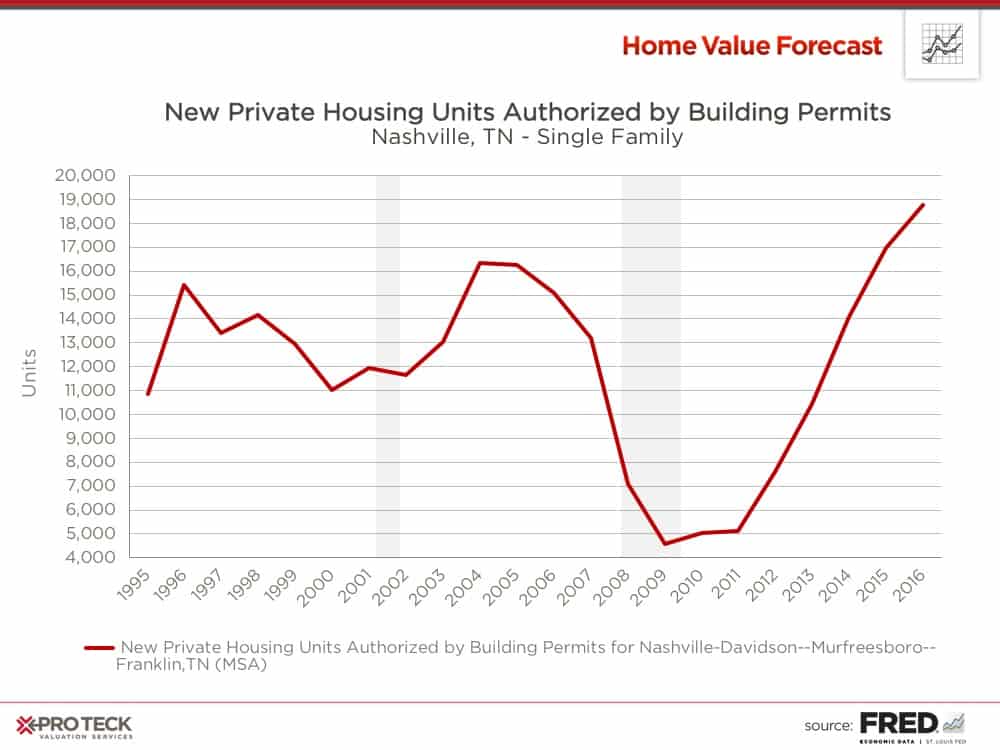
In the four years before the crash (2003 – 2006) Nashville averaged 15,000 building permits a year. This number bottomed out at less than 5,000 in 2009.
The below spreadsheet shows how this slowdown impacted housing inventory from years 2003 to 2016:
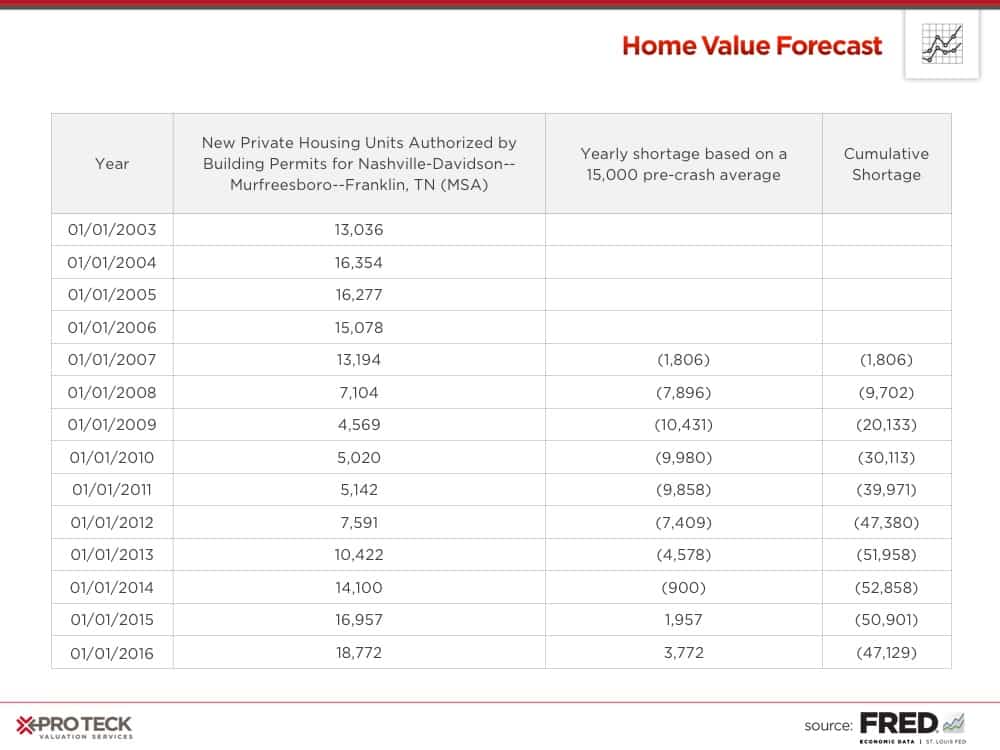
By 2014, the slowdown in Nashville housing starts had ballooned to a shortage of 53,000 new homes – which in turn created a nearly four-year backlog using the historic norm of 15,000. Fortunately, an increase in housing starts in 2015 and 2016 are chipping away at this number.
Pent-Up Demand Leads to Economic Displacement
An unfortunate impact of this pent-up demand has been economic displacement, as some residents can no longer afford to live in Nashville because of the rising prices.
The Tennessean newspaper has been writing about this trend, echoing similar themes to what Home Value Forecast discussed in its post about economic displacement in San Francisco. And just like in the Bay Area, the same is true in Nashville where properties in former working class neighborhoods are being bought up and built out – pushing lower income workers farther away from the city. And with investors paying a premium for land near the city, they need to build a bigger and more luxurious home to make a profit, thus economic displacement.
A Noticeable Lack of Affordable Homes
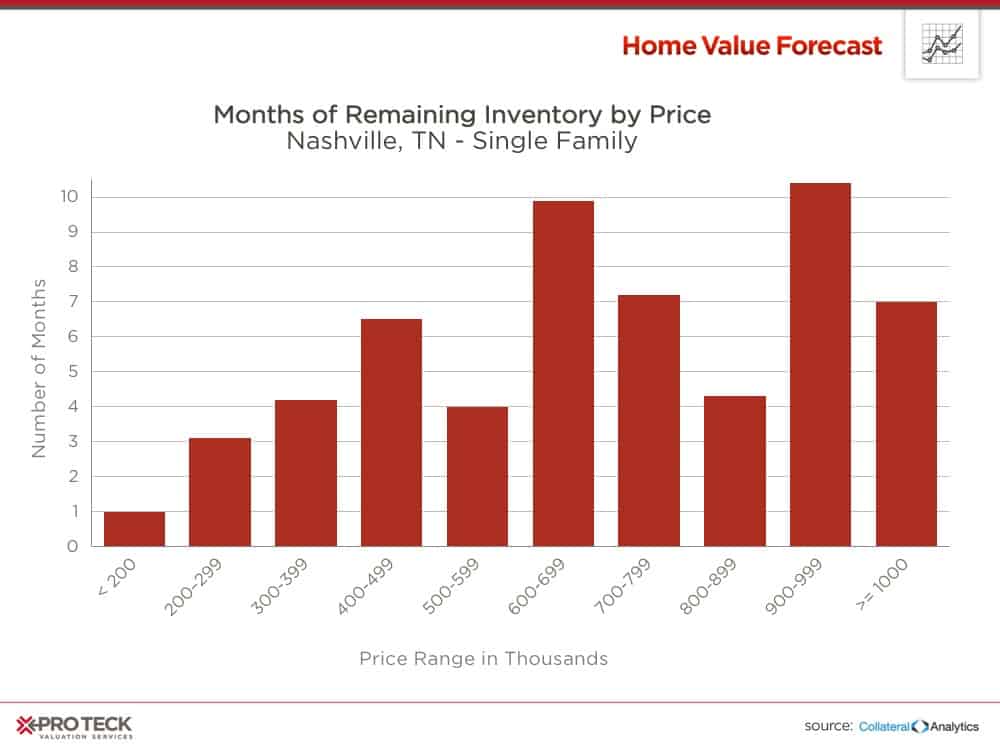
Looking at Months of Remaining Inventory (MRI) by price, one can see that there are not many options for those looking to purchase a home for less than $300,000.
But there is a glimmer of hope in Music City USA. Nashville Mayor Megan Barry says that developing a comprehensive strategy to add to affordable housing, including building along transit lines, is one of her administration’s top priorities.
CBSA Winners and Losers
Each month, Home Value Forecast uses a number of leading real estate market-based indicators to rank the single-family home markets in the top 200 CBSAs and highlight the strongest and weakest metros.
The ranking system is purely objective and is based on directional trends. Each indicator is given a score based on whether the trend is positive, negative or neutral for that series. For example, a declining trend in active listings would be positive, as will be an increasing trend in average price. A composite score for each CBSA is calculated by summing the directional scores of each of its indicators. From the universe of the top 200 CBSAs, each month we highlight the CBSAs which have the highest and lowest composite scores.
The tables below show the individual market indicators that are being used to rank the CBSAs, along with the most recent values and the percent changes. We have color-coded each of the indicators to help visualize whether it is moving in a positive (green) or negative (red) direction.
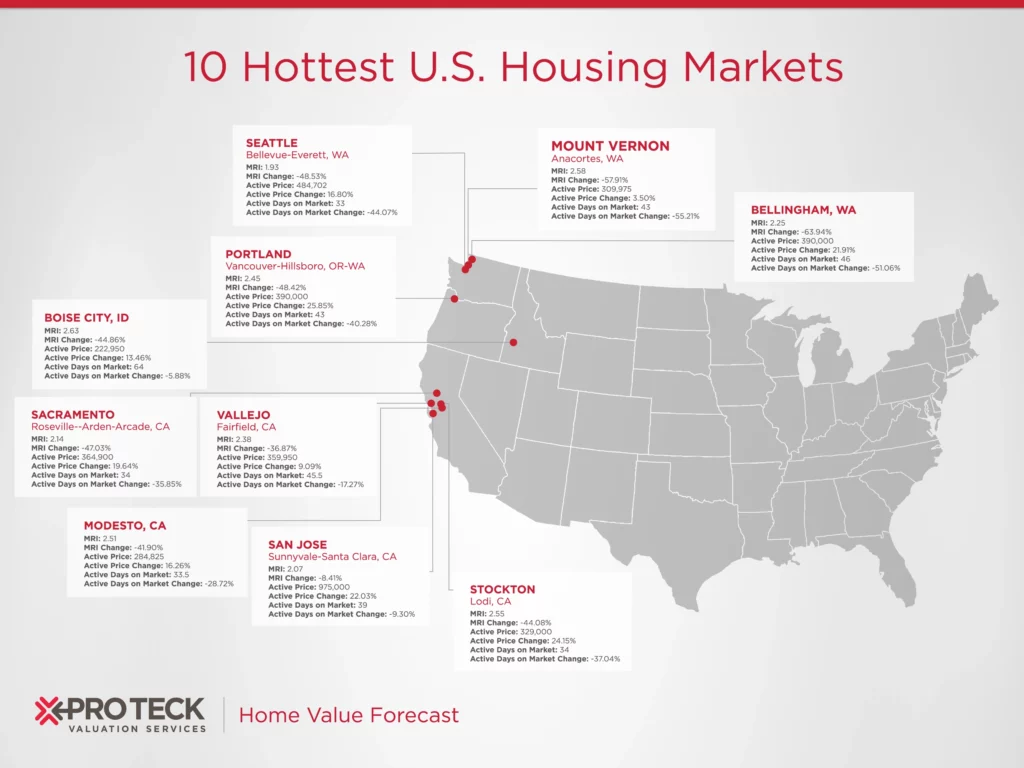
Top 10 CBSAs
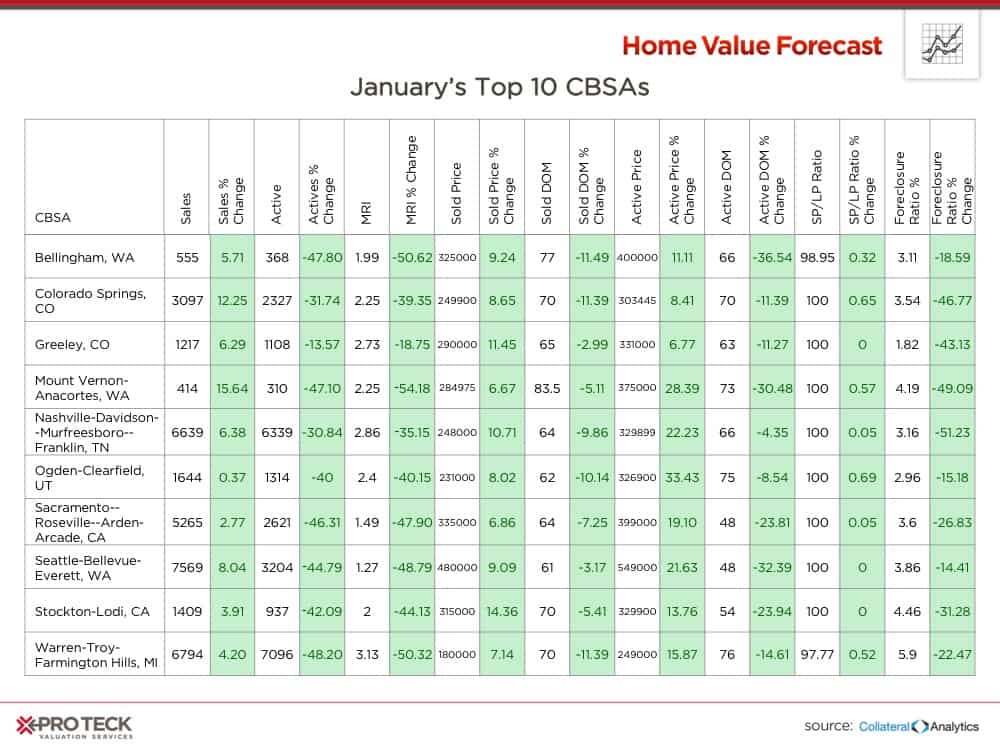
This month’s Top Ten includes three metros from Washington state, two from Colorado and two from California. We have been waiting for a slowdown in these markets, but haven’t seen it yet.
Bottom 10 CBSAs
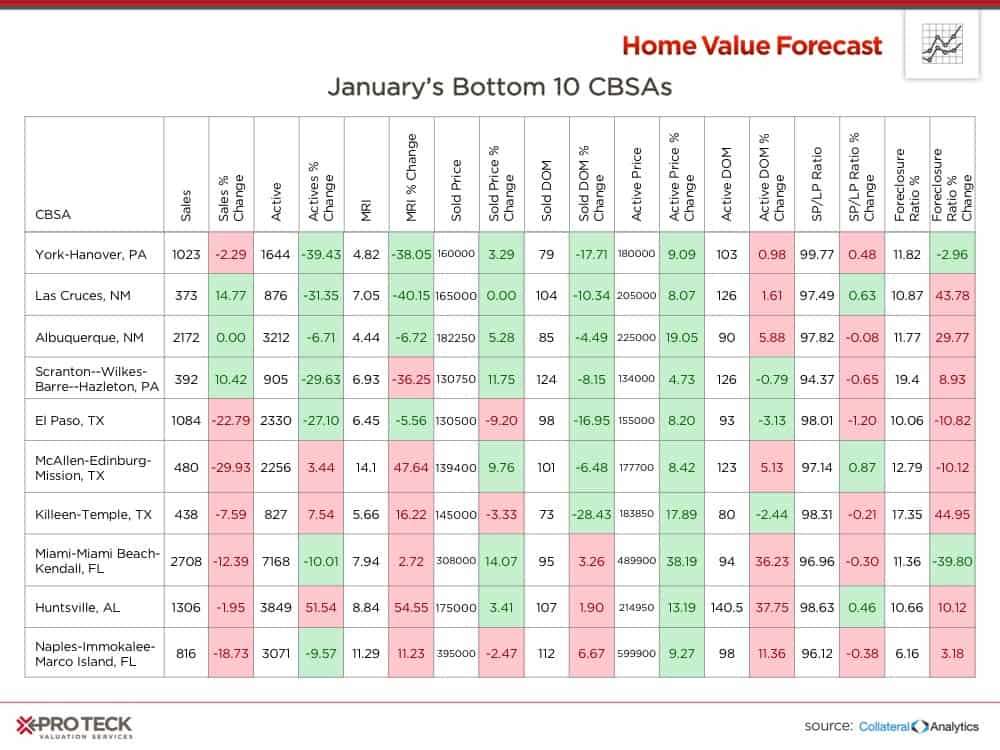
Similar to the Top Ten, the Bottom Ten features multiple metros from a handful of states. There are three metros from Texas represented, two from Pennsylvania and two from Florida. Recovery in these markets is still being impacted by foreclosure sales. With the current lack of inventory, the REO discount that slows appreciation should begin to shrink, which in turn will help these markets recover.
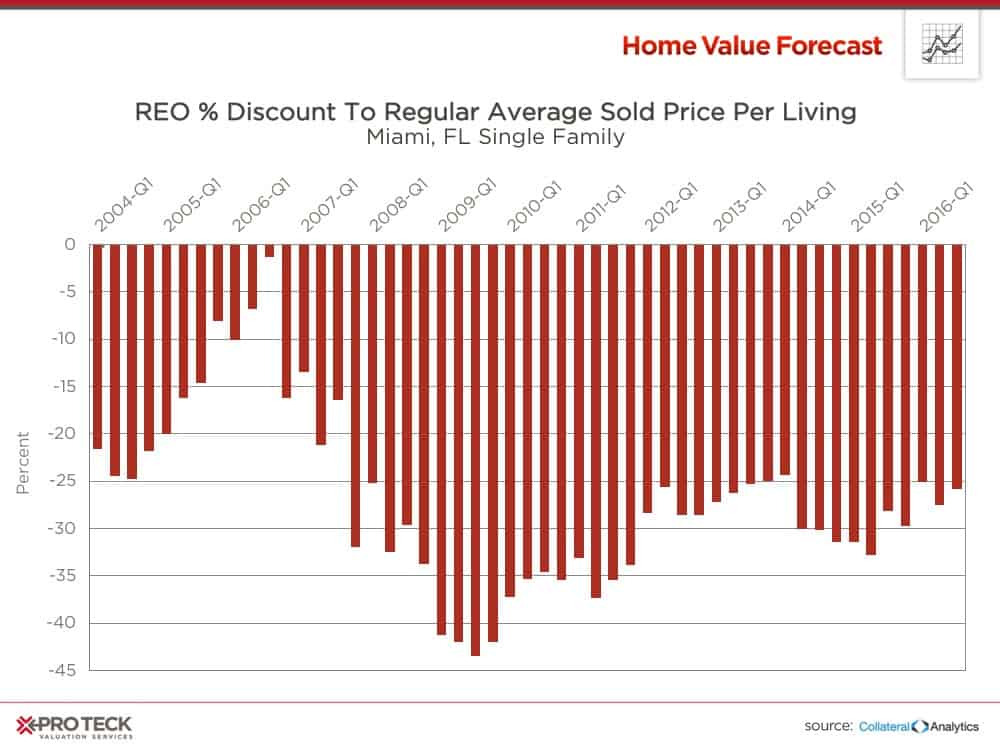
Miami has already seen its REO discount fall from a high of 42 percent in 2009 to the 20 percent range. As the number of REO sales as a percentage of market sales declines, sale prices should increase.
About Home Value Forecast
Home Value Forecast (HVF) is brought to you by SVI. HVF provides insight into the current and future state of the U.S. housing market, and delivers 14 market snapshot graphs from the top 30 CBSAs.
HVF is built using numerous housing and economic data sources. The top 750 CBSAs as well as data down to the ZIP code level for approximately 18,000 ZIPs are available with a corporate subscription to the service.
Also, SVI offers reporters the following:
- National, regional or metro level housing data
- Monthly updates and HVF insights articles
- By-request data for your story — custom data, heat maps and charts are available
- Expert commentary from Home Value Forecast Editorial Committee:
- Tom O’Grady, Chief Executive Officer, Pro Teck Valuation Services
- Michael Sklarz, PH.D., President, Collateral Analytics
- Jeff Dickstein, Chief Compliance Officer, Pro Teck Valuation Services