Home Value Forecast
Flint, MI CBSA Cracks the Top 10
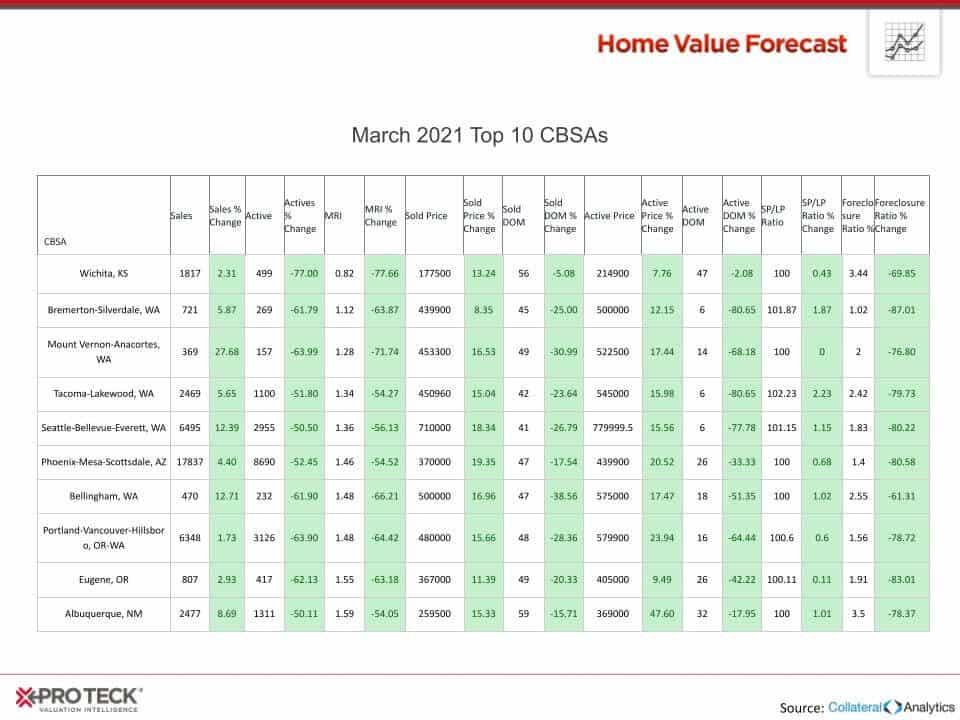
Each month, HVF’s Housing Market Report uses a number of leading real estate market-based indicators to report on activity in the single-family home markets in the top 200 metropolitan areas (CBSAs) in the U.S., and reports on the Top Ten.
When people hear Flint, MI, they usually think about the ongoing drinking water crisis and the impact it has had on families in the community.
We last wrote about the Flint CBSA in our August 2016 Home Value Forecast, and at the time they were part of our “Bottom 10” real estate market metros in America. This month, we are happy to report that the Flint, MI CBSA is part of our Top 10, with healthy trends across the board.
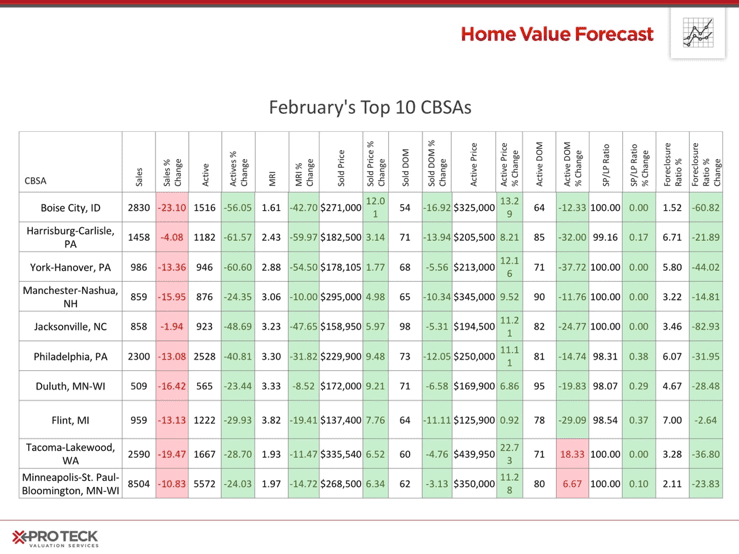
HVF’s ranking system is purely objective and is based on directional trends of nine key market indicators. It’s not a listing of what markets are most expensive or most exclusive, it’s about the overall health of the market and the pace of change and growth.
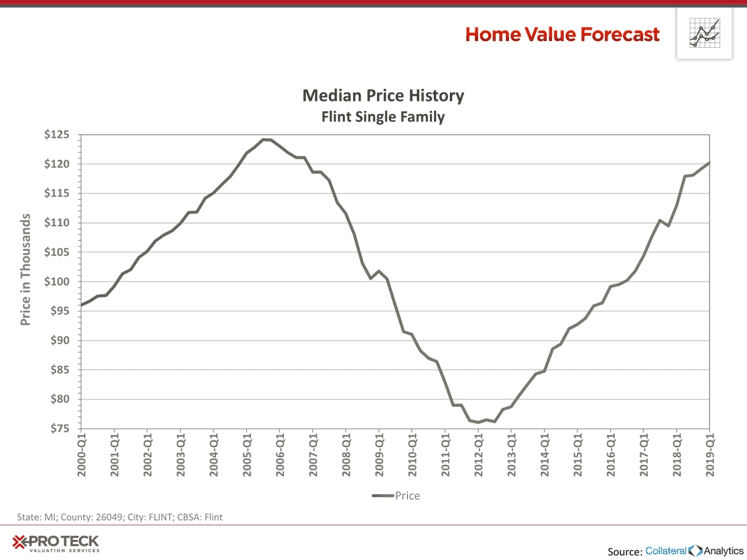
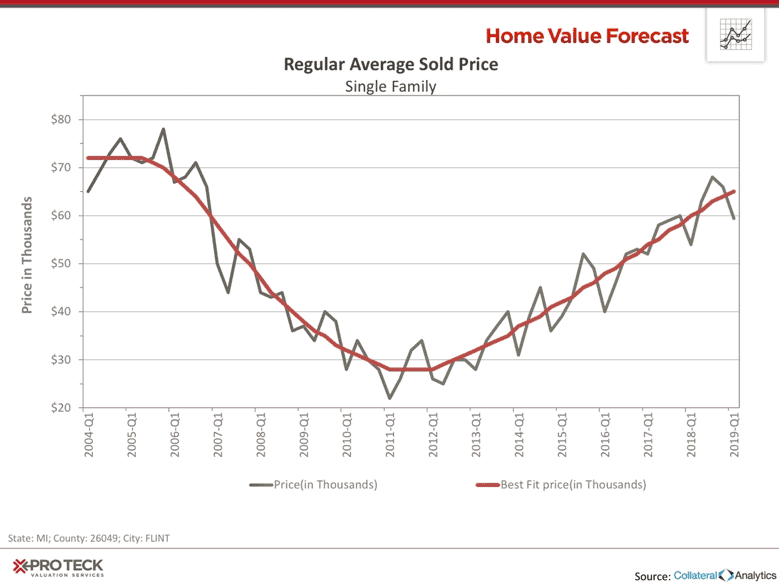
Looking at prices, we see steady increases in the CBSA since 2012. If recent appreciation continues, the CBSA will top pre-crash highs within the year.
The Flint CBSA encompasses all of Genesee County (population 409,000) – the population of the city of Flint (97,000) makes up about 24% of the county.
Looking at the City of Flint separately, the same upward momentum can be seen, albeit at a lower price point.
We often see a high correlation between employment and home prices –as evidenced by Flint-area employment bottoming out in 2009, and home prices following in 2011.
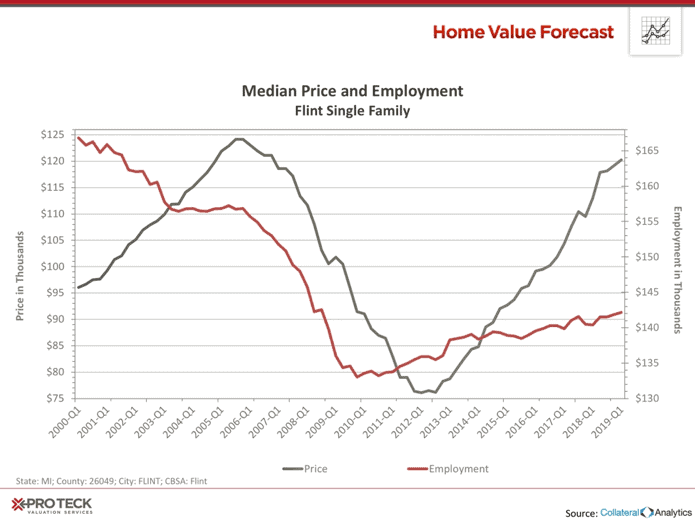
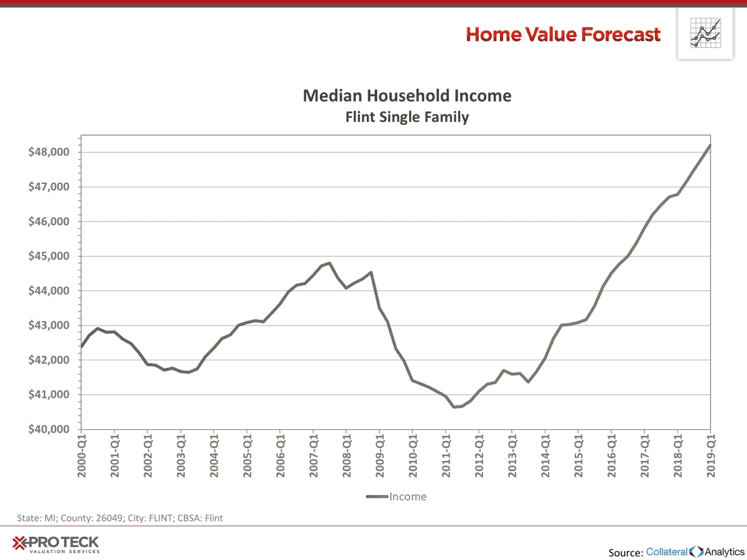
Unemployment topped 15% in 2009 for the CBSA, and 25% for the city of Flint – today the CBSA unemployment is 5%, and household income has hit new highs.
Here’s hoping that in 2019, Genesee County continues on this positive upswing, and Flint’s water issues are finally resolved.
Interested in learning more about the top metros featured in this month’s market report? Contact SVI for more in-depth information on each CBSA listed in this month’s report.
About SVI’s Monthly Housing Market Report
The Home Value Forecast uses a ranking system that is purely objective and is based on directional trends of nine market indicators. Each indicator is given a score based on whether the trend is positive, negative or neutral for that series. For example, a declining trend in active listings would be positive, as would an increasing trend in average price. A composite score for each CBSA is calculated by summing the directional scores of each of its indicators. From the universe of the top 200 CBSAs, each month we highlight topics and trends in the real estate market.