Home Value Forecast
Home Value Forecast: Drop in Listings Leads to Bidding Wars
Each month, Home Value Forecast uses a number of leading real estate market-based indicators to monitor single-family home market activity in the nation’s top 200+ metropolitan areas (CBSAs) and report on the Top 10.
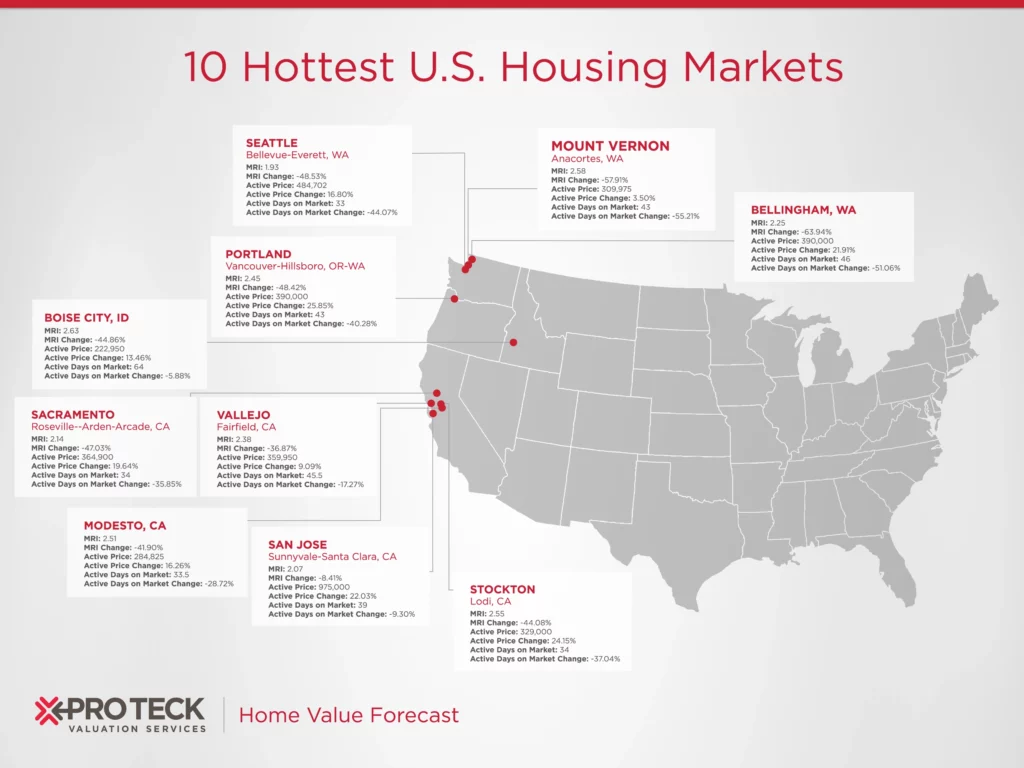
THE TOP 10
The Home Value Forecast Top 10 Hottest Housing Markets ranking system is purely objective and is based on directional trends over the past eight quarters. It’s not a listing of what markets are most expensive or most in need of inventory – it ranks market momentum at a specific point in time.
This month’s Top 10 shows an imbalance in supply and demand market dynamics:
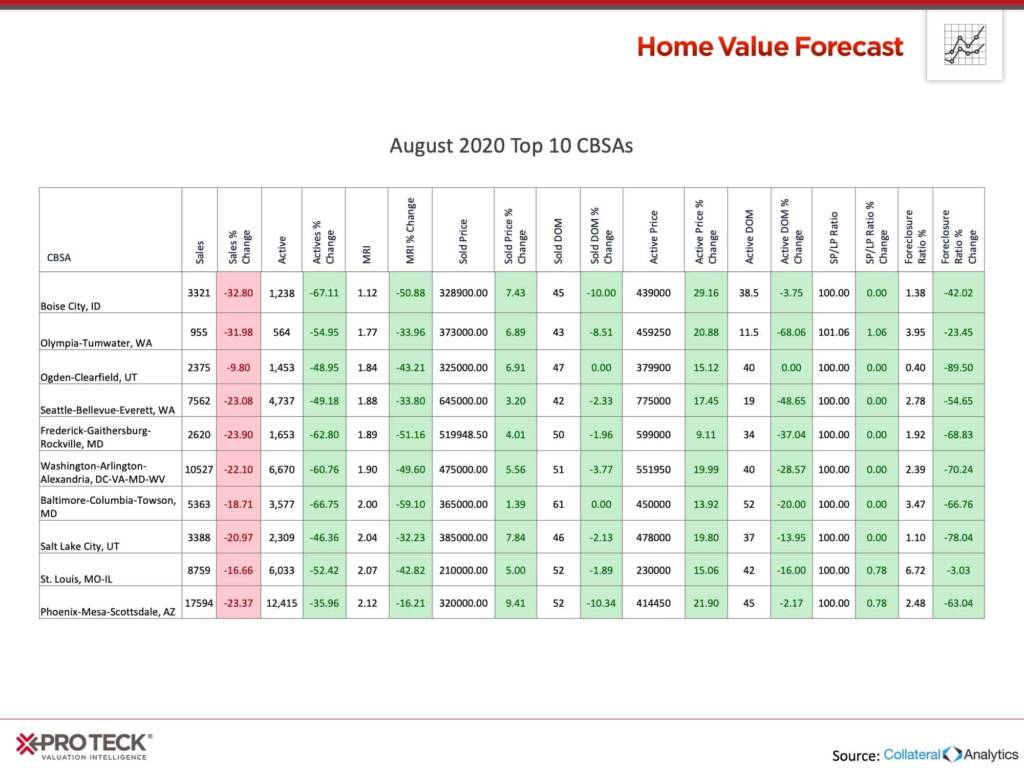
Our numbers look at a rolling three-month period compared to the same rolling three-month period from last year. Looking at sold percent change and active percent change, we can get a better read on the overall theme of the market:
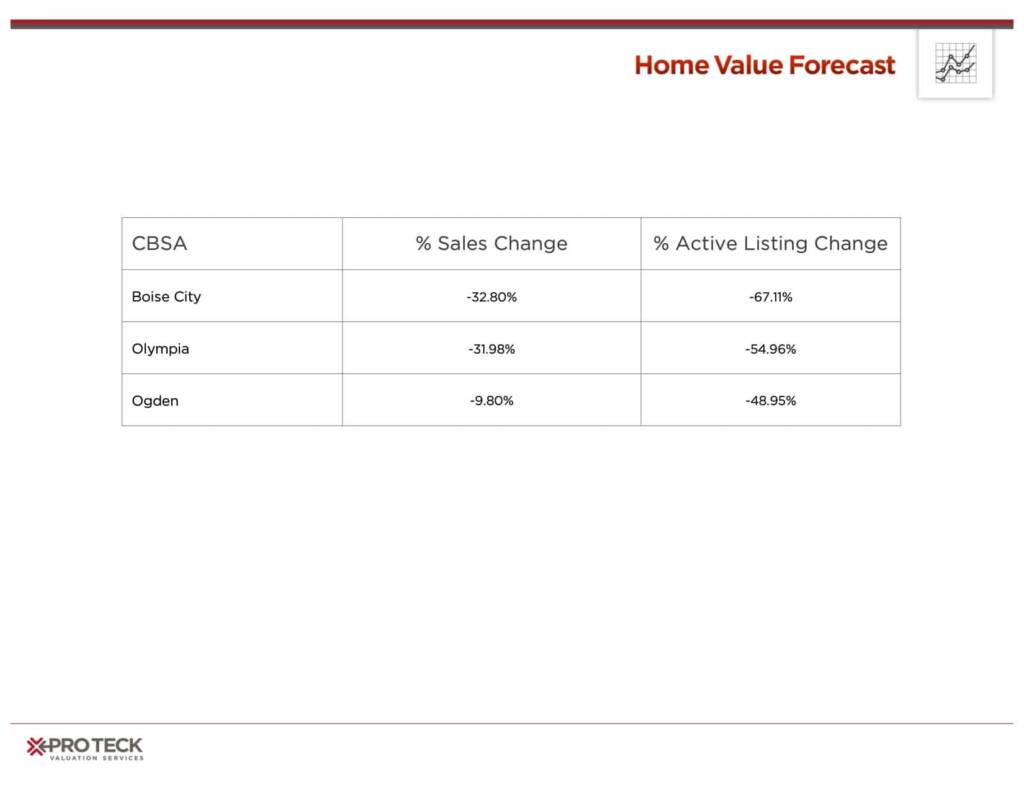
When we look at the Top 10 overall, the weighted average shows a 21.79% reduction in sales and a whopping 50.08% drop in active listings. This lack of inventory coupled with strong demand has led to less than 2 months of remaining inventory (MRI) for our Top 10 metros, creating even more bidding wars and an incredible drop in average days on market.
There are too many variables today to tell when we’ll see an increase in inventory. Currently it’s very much a seller’s market, but the pandemic combined with political, social and economic uncertainty are keeping many would-be sellers on the sidelines.
In the 2008 housing crisis, foreclosure properties quickly flooded the market, dragging down prices. Today, state and federal moratoriums on foreclosures have so far stemmed the tide. This, combined with Americans having more home equity than at any time in the last 20 years, should lead to more loan modifications/workouts and fewer foreclosures … as long as an end to the current crisis is in sight.
ABOUT SVI’S MONTHLY HOUSING MARKET REPORT
The Home Value Forecast uses a ranking system that is purely objective and is based on directional trends of market indicators. Each indicator is given a score based on whether the trend is positive, negative or neutral for that series. For example, a declining trend in active listings would be positive, as would an increasing trend in average price. A composite score for each CBSA is calculated by summing the directional scores of each of its indicators. From the universe of the top 200 CBSAs, each month we highlight topics and trends in the real estate market.