Home Value Forecast
Home Value Forecast: A+ for Albuquerque, NM
Each month, Home Value Forecast uses a number of leading real estate market-based indicators to report on activity in the single-family home markets in the top 200+ metropolitan areas (CBSAs) in the U.S., and reports on the Top Ten.
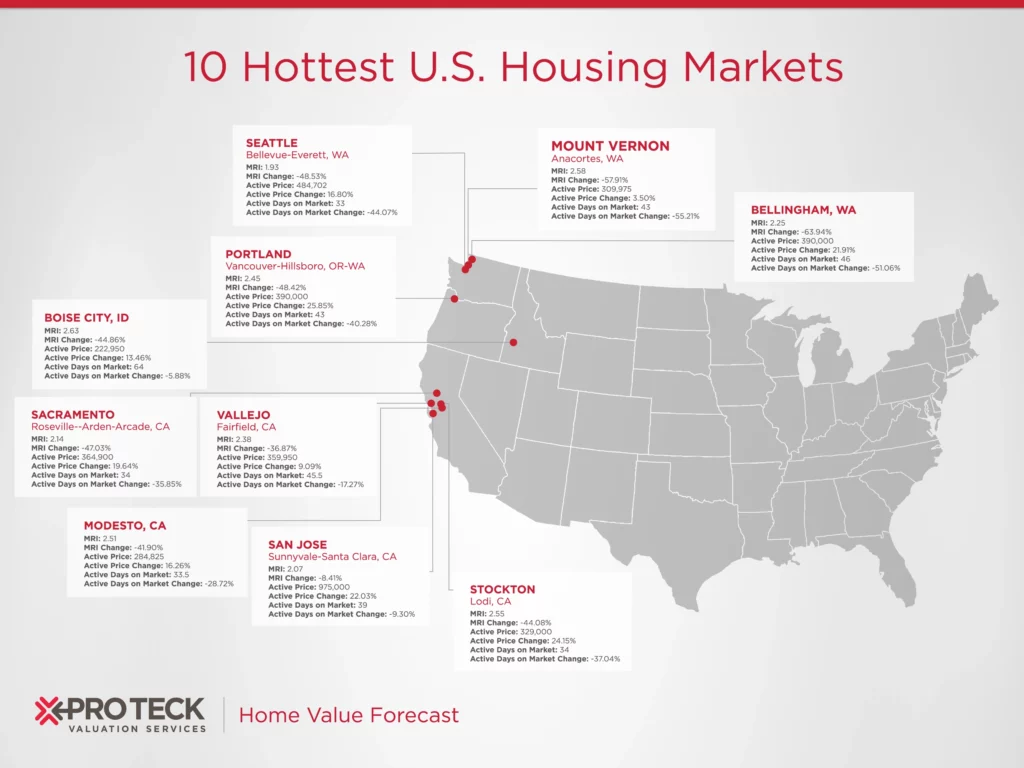
The Top 10
The Home Value Forecast Top 10 ranking system is purely objective and is based on directional trends. It’s not a listing of what markets are most expensive or most in need of inventory — it ranks market momentum at a specific point in time.
This month’s Top 10 metros again highlight cities across the country:

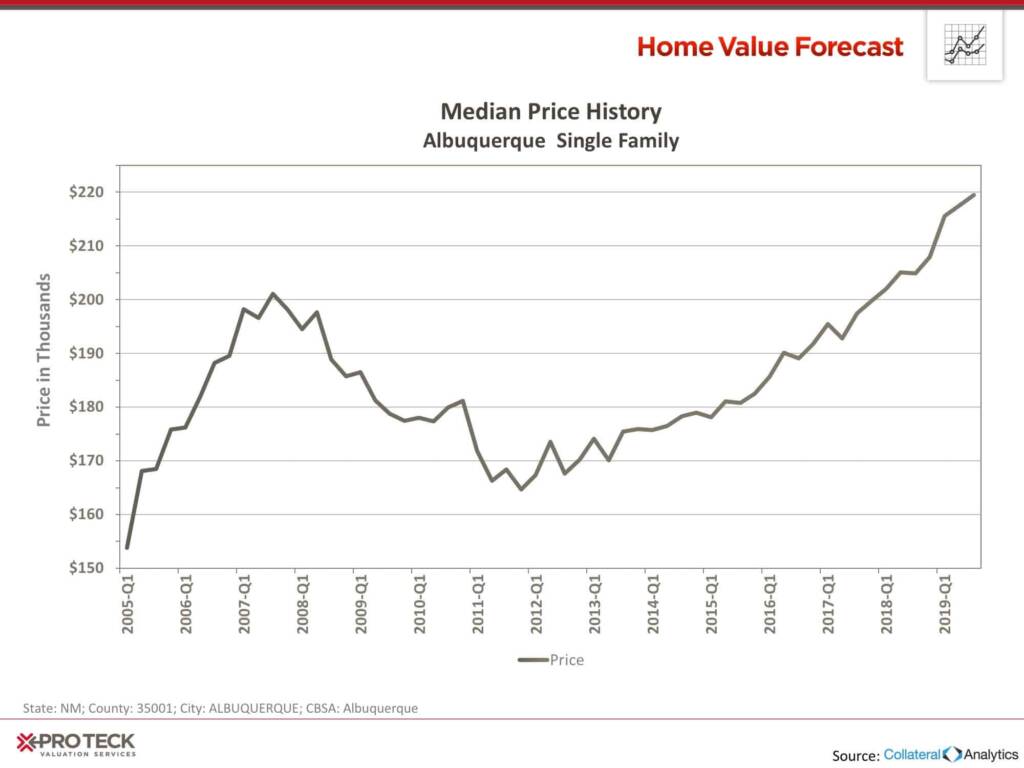
Albuquerque, NM CBSA
The Albuquerque, NM CBSA has shown consistent price appreciation since its 2011 low, now at an all-time high:
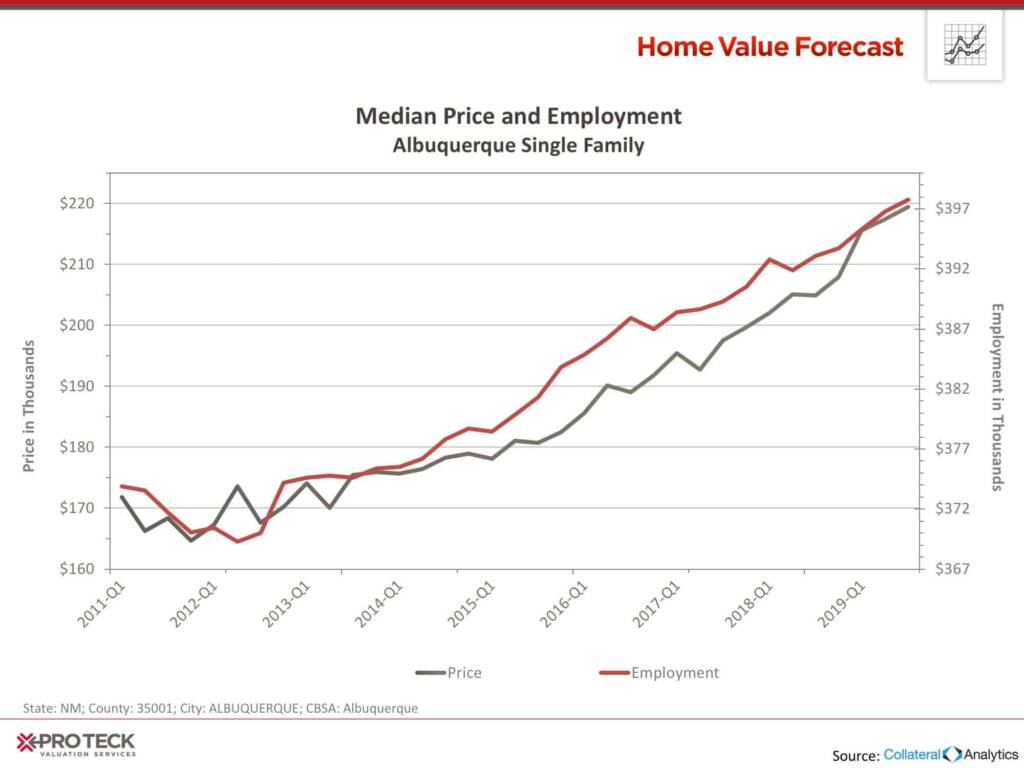
Albuquerque’s industrial base includes aerospace, defense, energy technology and computer chip manufacturers. Employment and home prices have been highly correlated since 2011, signaling that price appreciation is being driven by supply and demand market fundamentals.
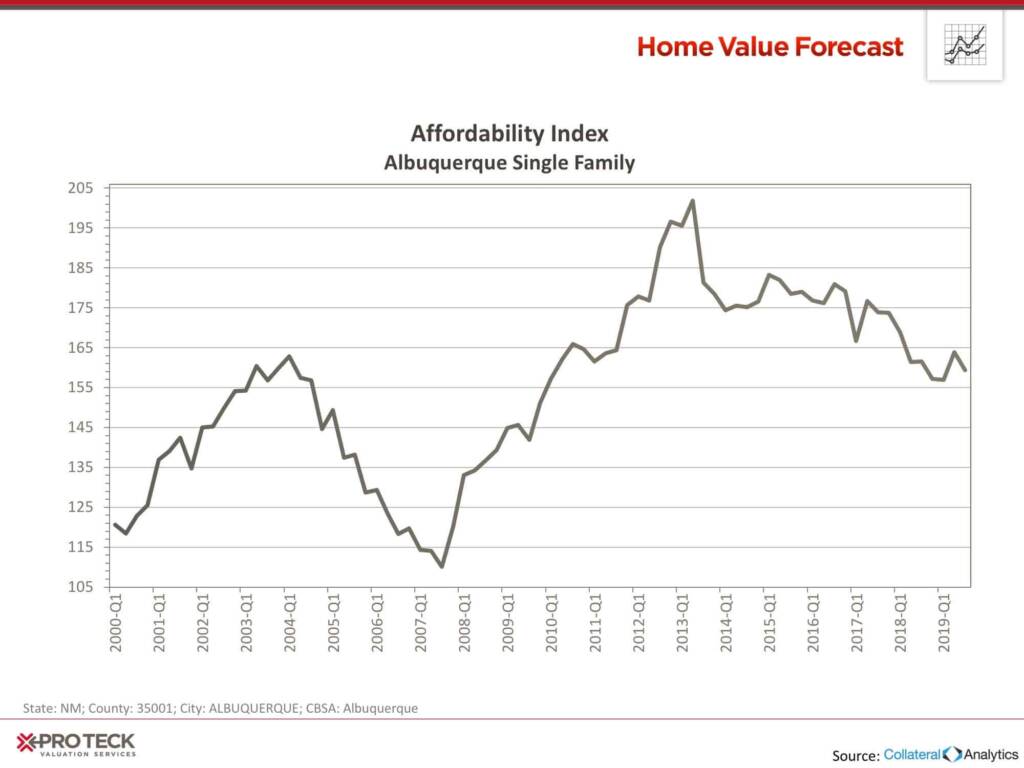
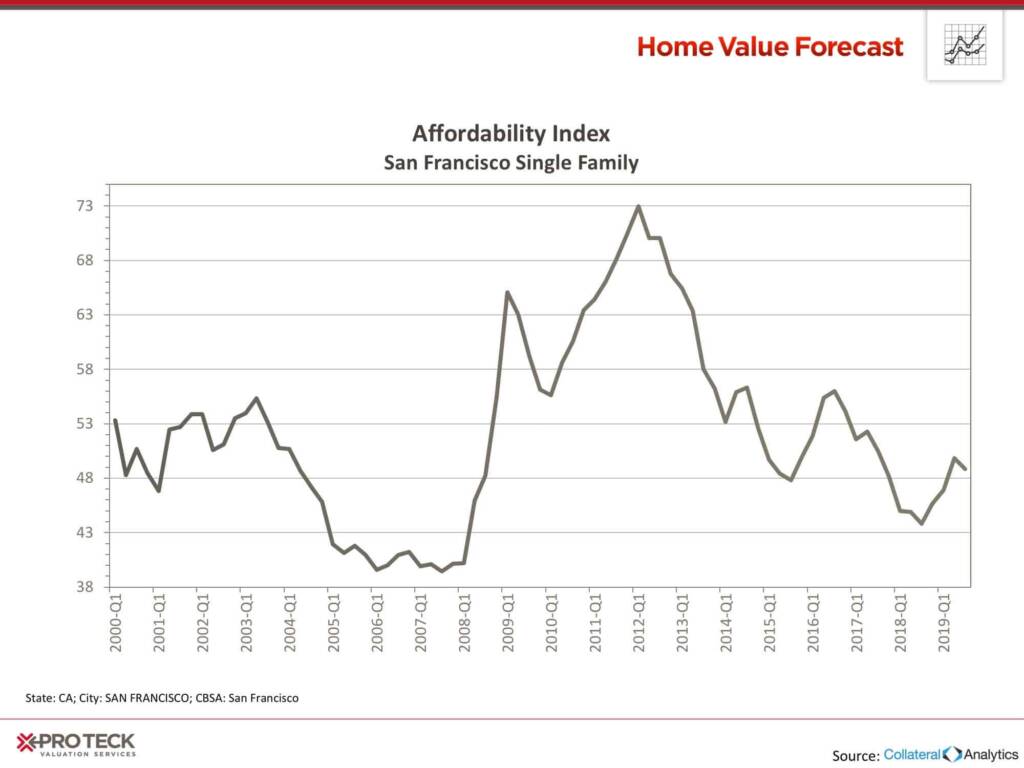
So, is Albuquerque still affordable, even with price appreciation? Let’s look at home affordability via an affordability index.
Affordability is derived by comparing the median income for a particular area to the mortgage payment needed to purchase a median priced home. An index score above 100 signifies that a household earning the median income has more than enough income to afford the mortgage. Lower scores suggest more income is needed to cover mortgage expenses. The Collateral Analytics Affordability Index used by Home Value Forecast also looks at loan-to-value norms for a particular area to adjust for more affluent buyers usually putting more money down.
While affordability is trending down, we don’t expect to see a “bubble” anytime soon.
And compared to the nation’s most expensive CBSA, San Francisco, Albuquerque is a bargain!
Interested in learning more about the top metros featured in this month’s market report? Contact SVI for more in-depth information on each CBSA listed in this month’s report.
About SVI’s Monthly Housing Market Report
The Home Value Forecast uses a ranking system that is purely objective and is based on directional trends of nine market indicators. Each indicator is given a score based on whether the trend is positive, negative or neutral for that series. For example, a declining trend in active listings would be positive, as would an increasing trend in average price. A composite score for each CBSA is calculated by summing the directional scores of each of its indicators. From the universe of the top 200 CBSAs, each month we highlight topics and trends in the real estate market.