Home Value Forecast
Home Value Forecast: COVID-19 & Its Potential Impact on Housing Markets
Each month, Home Value Forecast uses a number of leading real estate market-based indicators to monitor single-family home market activity in the in the nation’s top 200+ metropolitan areas (CBSAs) in the U.S., and reports on the Top 10.
The numbers in this report were from the three-month period ending in late March, 2020. Much of the data is before COVID-19 had impacted the market.
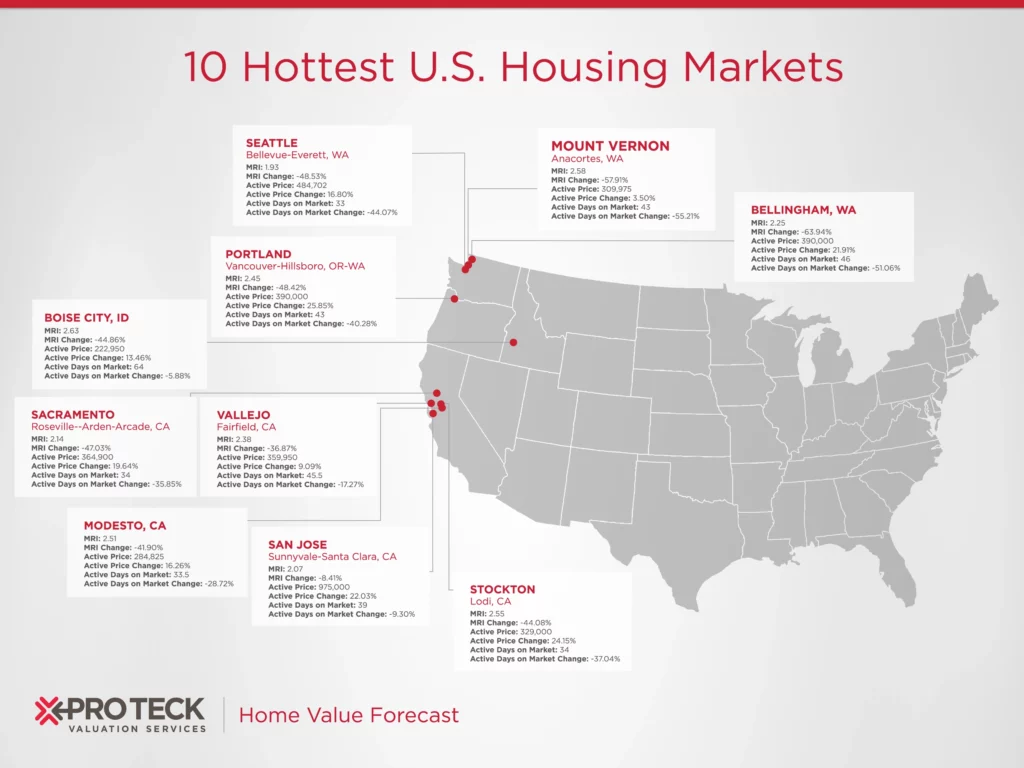
THE TOP 10
The Home Value Forecast Top 10 Hottest Housing Markets ranking system is purely objective and is based on directional trends over the past eight quarters. It’s not a listing of what markets are most expensive or most in need of inventory – it ranks market momentum at a specific point in time.
This month’s Top 10 includes nine metros from the west, with Manchester, NH, making the list as the lone eastern metro.
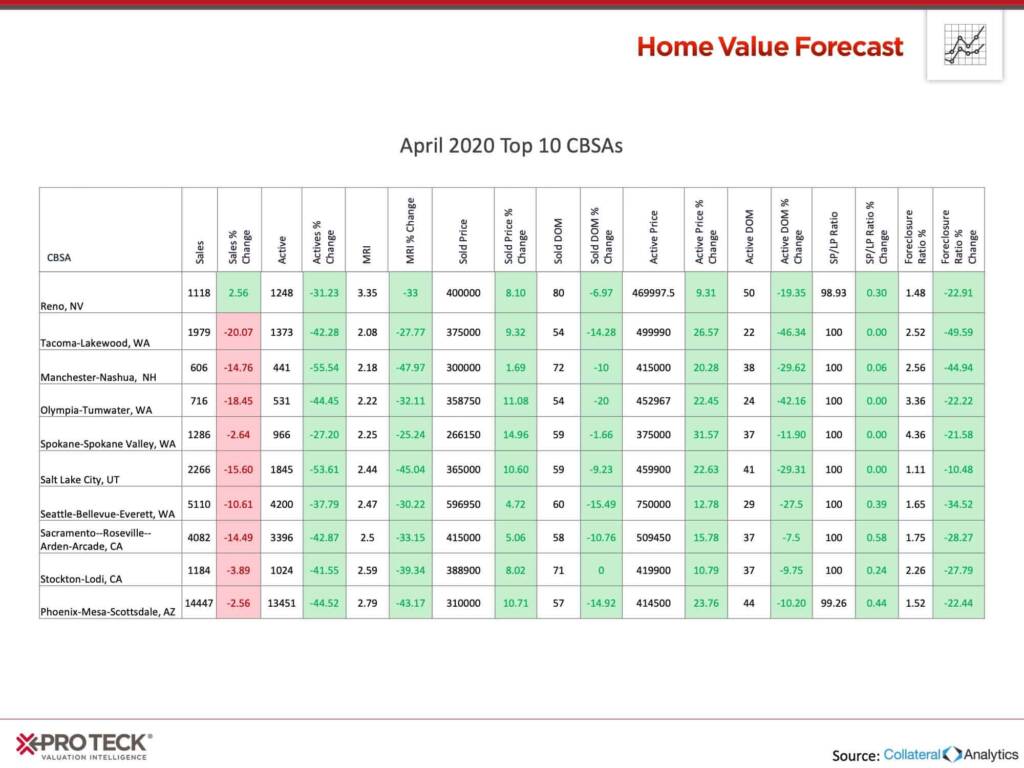
What’s interesting to see is that sales in nine of the 10 markets were down compared to the same three-month period last year. Overall, 90.4% of the metros we track saw a decline in sales for this period, which we speculate is the first sign of COVID-19’s impact on our numbers.
Bottom 10:
We haven’t looked at the bottom 10 markets for a while, but given the uncharted territory we find ourselves in now, we decided to take a look so we could track changes as markets get impacted by COVID-19.
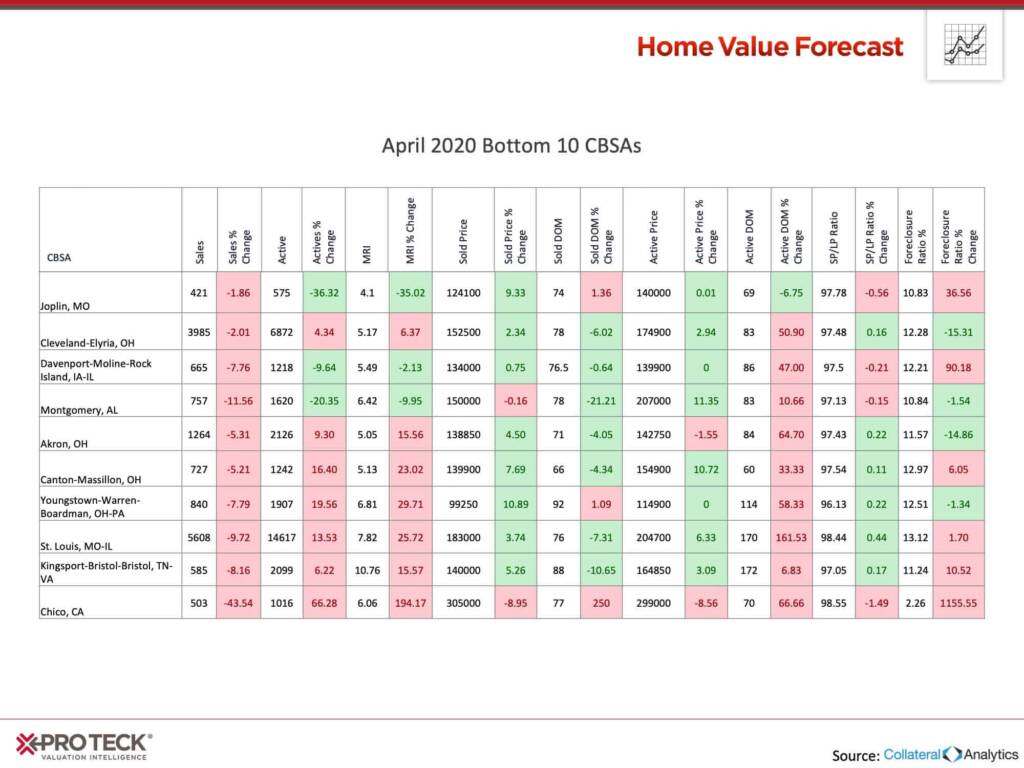
One thing to notice on this report are the positive trends, indicated in green, above. Our seven market condition classifications go: Hot, Strong, Good, Normal, Soft, Weak and Distressed. For this month we have no markets in either the “Weak” OR “Distressed” categories. The percentage of markets in each category are:
- Hot: 12%
- Strong: 37%
- Good: 26%
- Normal: 13%
- Soft: 12%
We will keep an eye on changes in this distribution in the months ahead.
ABOUT STEWART VALUATION INTELLIGENCE’S MONTHLY HOUSING MARKET REPORT
The Home Value Forecast uses a ranking system that is purely objective and is based on directional trends of market indicators. Each indicator is given a score based on whether the trend is positive, negative or neutral for that series. For example, a declining trend in active listings would be positive, as would an increasing trend in average price. A composite score for each CBSA is calculated by summing the directional scores of each of its indicators.