Home Value Forecast
Home Value Forecast: Lack of Inventory to Hamper Home Buying Season
Much of the news lately has been about the lack of inventory as we head into the home buying season. According to a recent article in Mortgage Professional America, Freddie Mac has indicated that the lack of supply is one of its top concern heading into the spring buying season — even going as far as to theorize that home sales in 2017 may fail to reach levels of last year.
The lack of housing inventory comes as a result of a combination of factors; most notably the reduction of new housing starts post-crisis, investors buying and now renting homes, and the lack of equity and/or rising interest rates keeping people in their homes longer than anticipated.
This month’s Home Value Forecast looked at national inventory trends over the last three years and came to the following conclusion — the lack of inventory is in fact very real.
An In-depth Look at Inventory
Home Value Forecast looks at inventory through the lens of Months Remaining Inventory (MRI), which is defined as the current number of active listings divided by the monthly sales rate. It combines both supply and demand into one number, giving a more holistic view of the state of the market.
The chart below shows the weighted average MRI for the 200+ metros Home Value Forecast tracks. According to this data, there has been a 14.4% drop in MRI from last year, and a full 25% drop in the last two years.
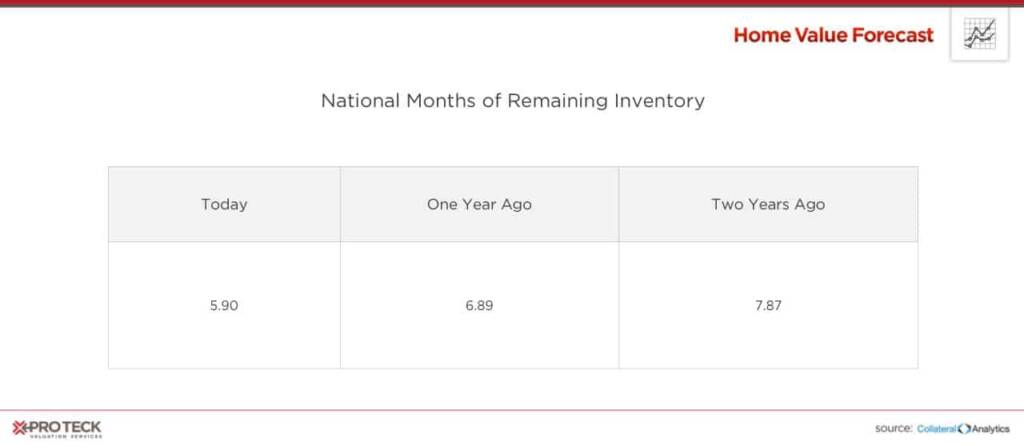
Traditionally, a balanced market would have an MRI between six and 10 months. This month, only eight metros we track have MRIs over 10, compared to 27 last year and 48 two years ago – illustrating that this lack of inventory is not being driven by traditionally “hot” markets, but is rather a national phenomenon.
What’s the Story in Seattle?
The five metros with the lowest Months of Remaining Inventory are all from California and Washington state — a list led by Seattle, WA.
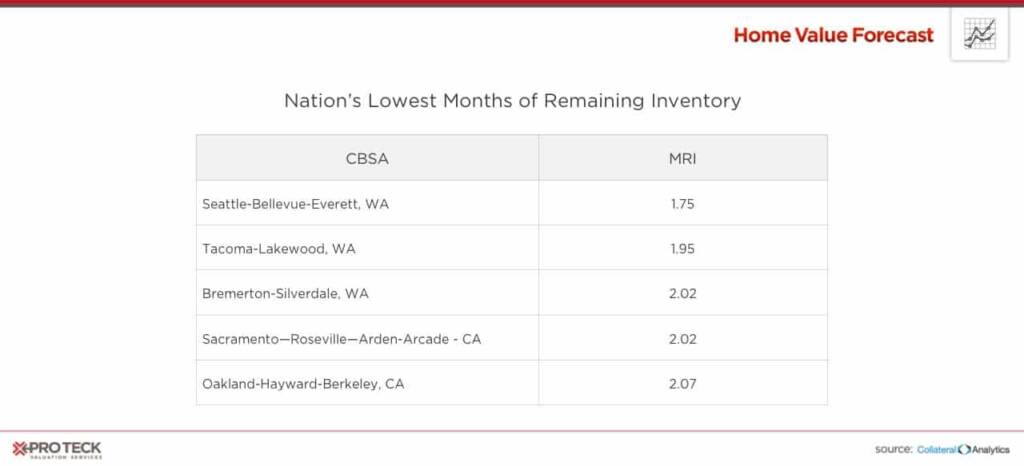
Seattle, which is also in our Top Ten this month, has the lowest MRI of the five with 1.75. Looking at MRI by home price in the Seattle market shows just how hard it is to find a traditional “starter” home at the lower end of the price range.
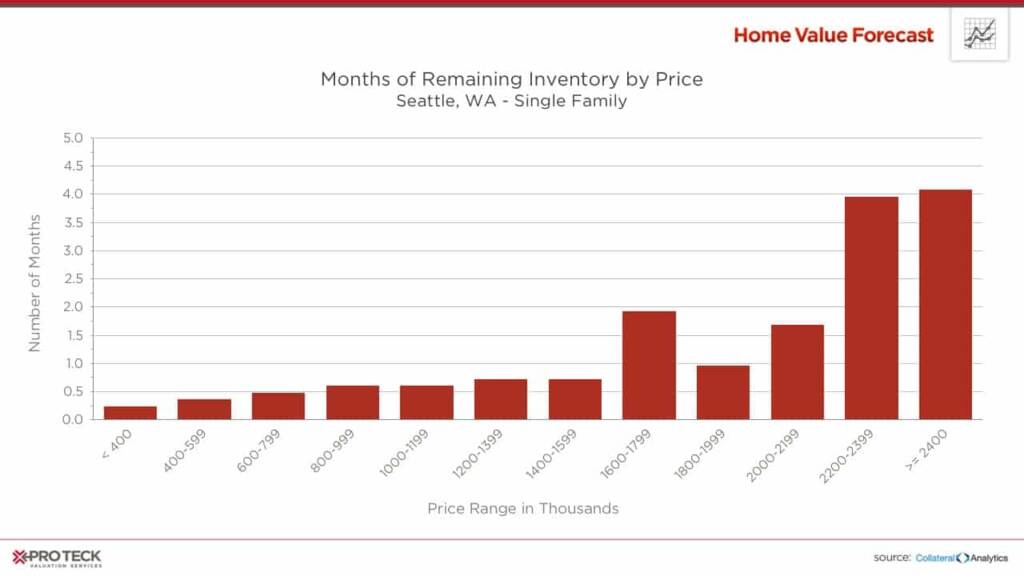
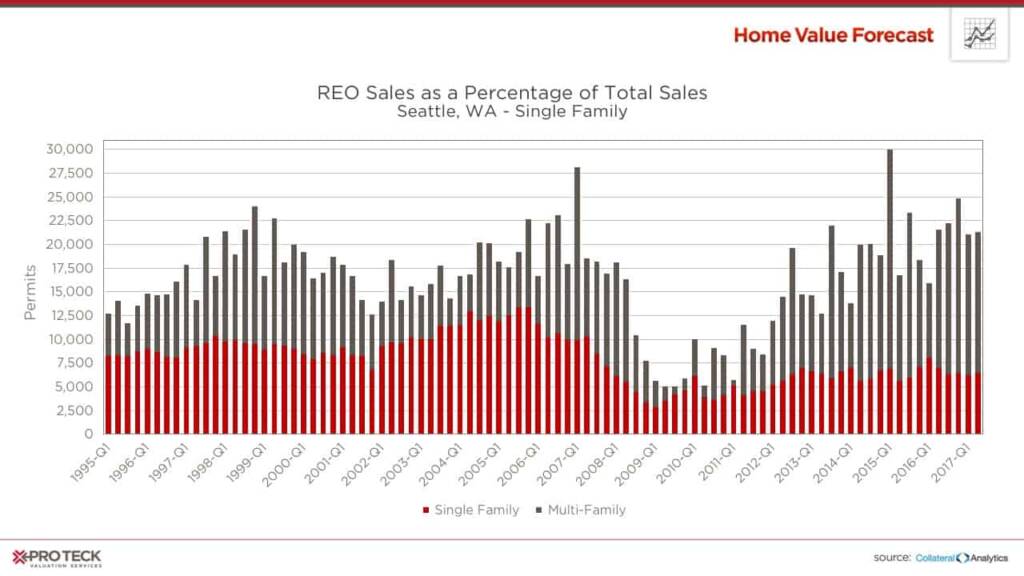
Seattle has a dire need for more single family, moderately-priced homes, as supply has not kept up with demand, leading to limited inventory and increasing prices. While more multi-family homes are being built, single-family home starts are still at a fraction of pre-crash levels.
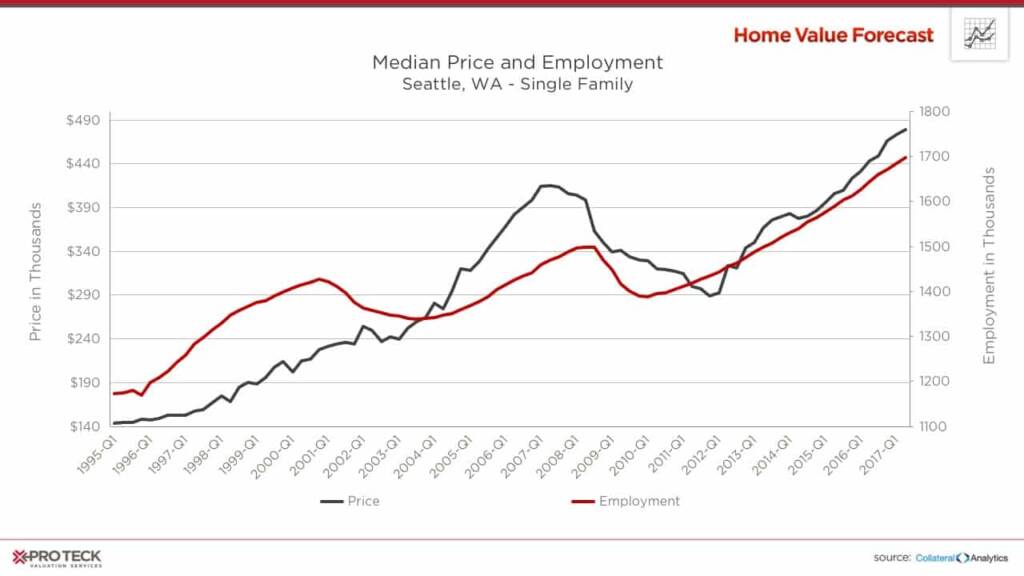
The limited inventory, coupled with high employment and household income gains, have all combined to create record housing price increases as shown in the chart below.
CBSA Winners and Losers
Each month, Home Value Forecast uses a number of leading real estate market-based indicators to rank the single-family home markets in the top 200 CBSAs and highlight the strongest and weakest metros.
The ranking system is purely objective and is based on directional trends. Each indicator is given a score based on whether the trend is positive, negative or neutral for that series. For example, a declining trend in active listings would be positive, as will be an increasing trend in average price. A composite score for each CBSA is calculated by summing the directional scores of each of its indicators. From the universe of the top 200 CBSAs, each month we highlight the CBSAs which have the highest and lowest composite scores.
The tables below show the individual market indicators that are being used to rank the CBSAs, along with the most recent values and the percent changes. We have color-coded each of the indicators to help visualize whether it is moving in a positive (green) or negative (red) direction.
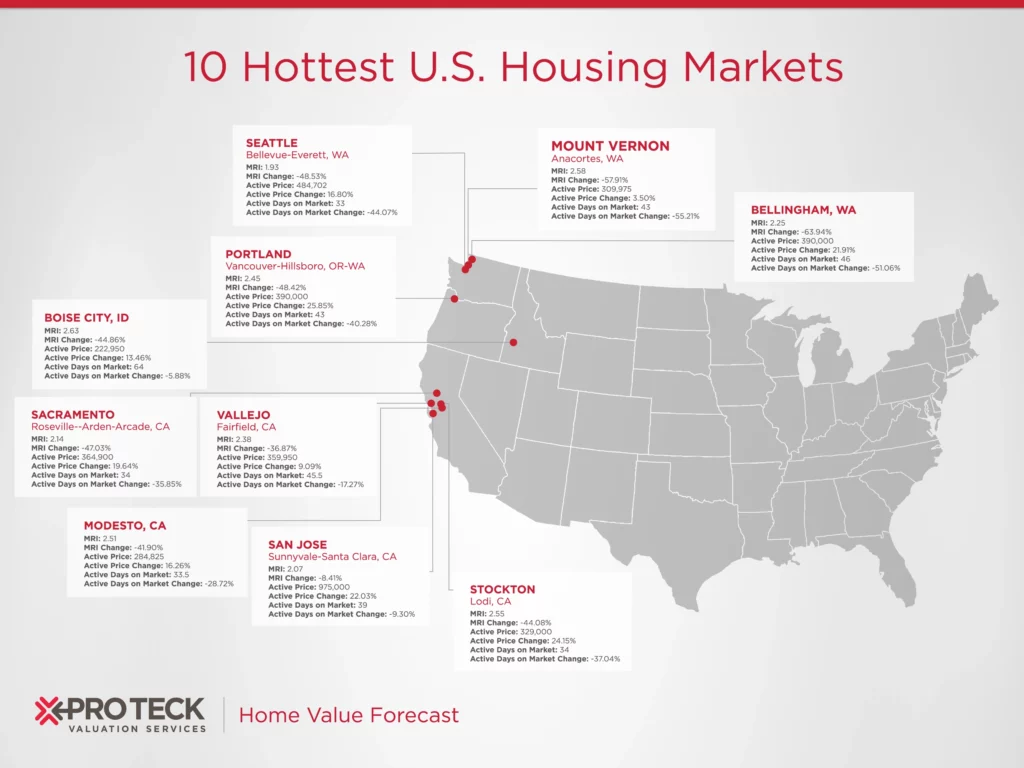
Top 10 CBSAs
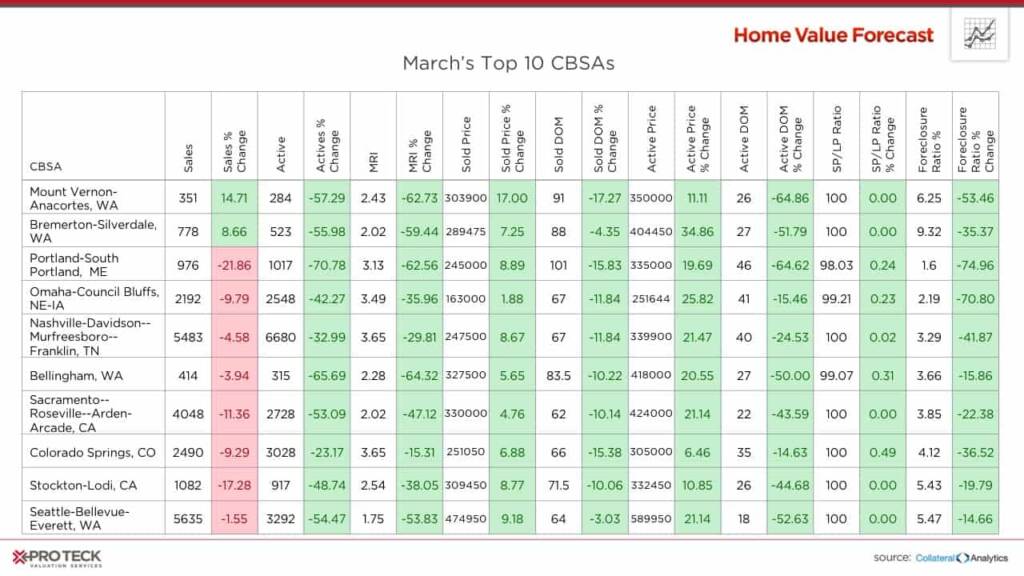
Once again this month, the Top Ten is all about supply, with all 10 seeing a decrease in active homes on the market, leading to quick sales and fierce competition. This competition should continue through the peak home selling months.
Bottom 10 CBSAs
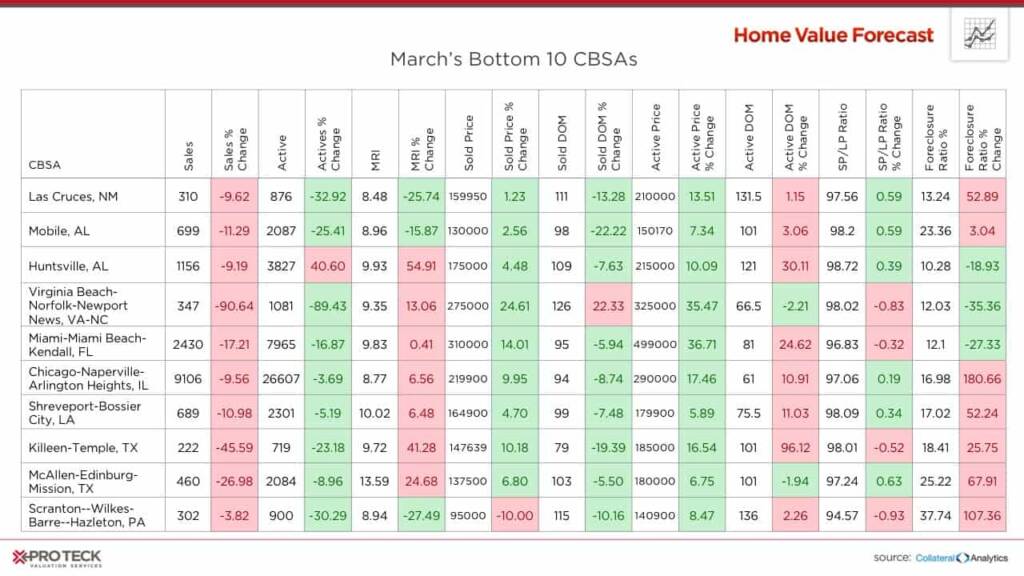
The Scranton-Wilkes-Barre-Hazleton, PA, CBSA is in our bottom 10 this month, as higher foreclosures and longer days on market stall any significant price gains. The area lost a considerable number of jobs post housing crisis:
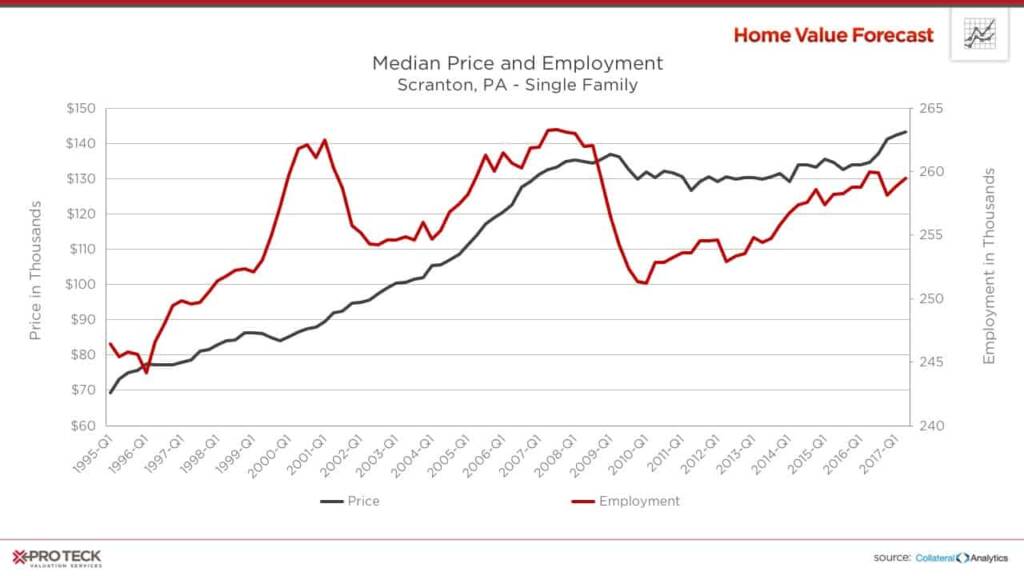
While some job growth has occurred, home prices have been relatively flat over the last 10 years.
ABOUT SVI’S MONTHLY HOUSING MARKET REPORT
The Home Value Forecast uses a ranking system that is purely objective and is based on directional trends of market indicators. Each indicator is given a score based on whether the trend is positive, negative or neutral for that series. For example, a declining trend in active listings would be positive, as would an increasing trend in average price. A composite score for each CBSA is calculated by summing the directional scores of each of its indicators.