Home Value Forecast
Home Value Forecast: Denver Dealing with the Impact of Limited Housing Inventory
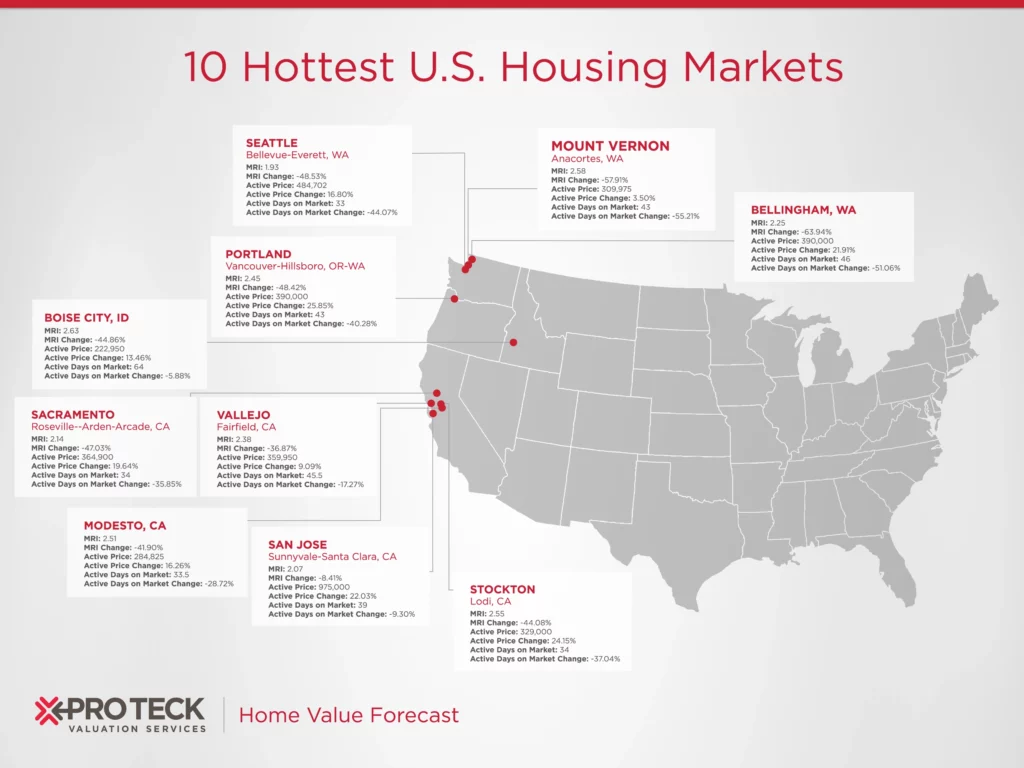
Denver is in our Top 10 this month, and shares many of the attributes of the other nine metros: booming employment and higher wages leading to increased home prices and less inventory. Recent regulatory actions will hopefully help spur building at the lower end of the market where these issues are more pronounced.
Denver Economic and Real Estate Trends
Unemployment in Denver peaked in 2010 and is now close to historic lows.
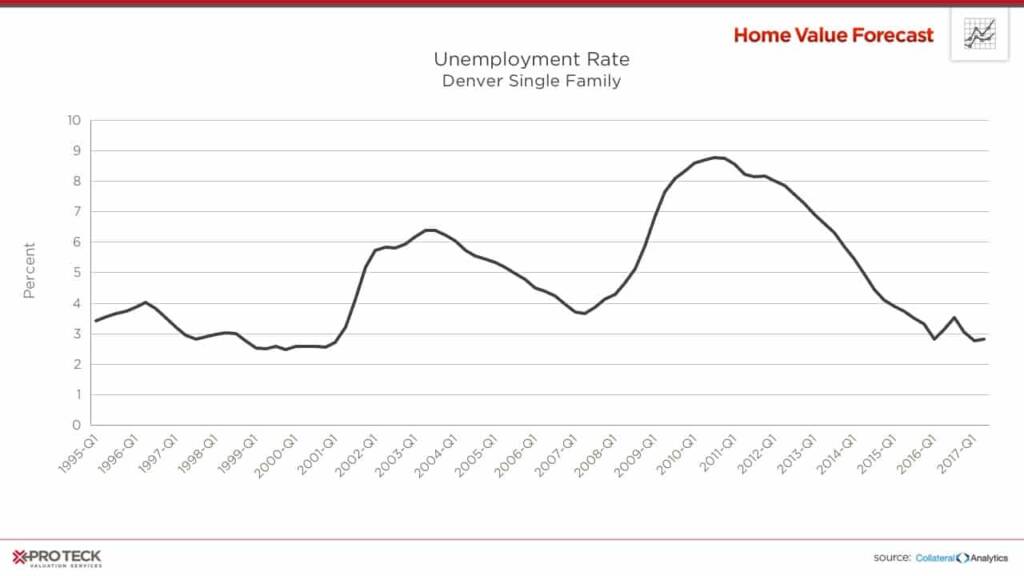
Employment levels are a statistical factor closely correlated to home prices, and in Denver the correlation is readily apparent:
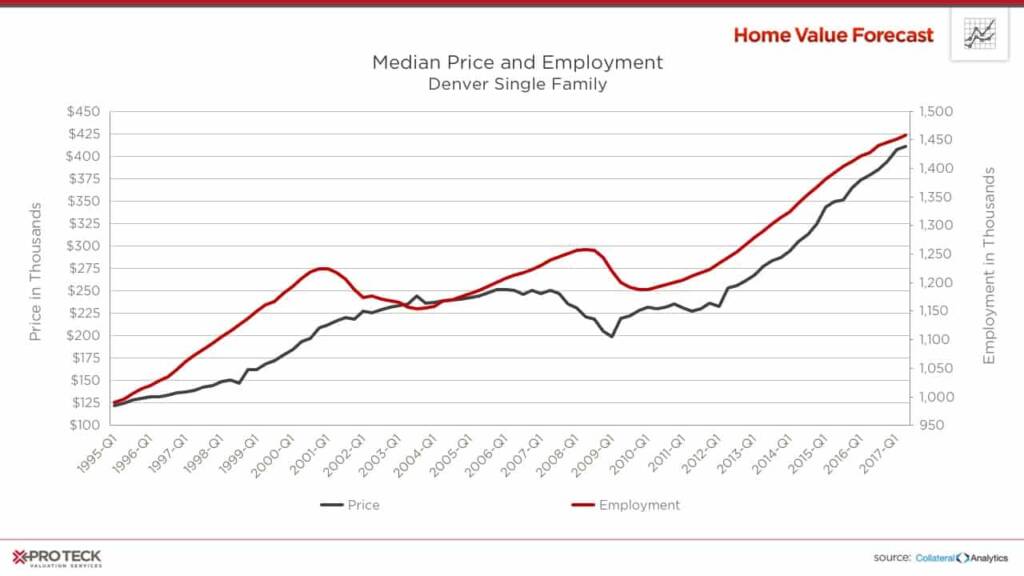
If you look at Q4 in 2000, the last time unemployment was around 3 percent, employment was at 1,225,000; today it’s at 1,445,000, a 19 percent increase. Median household income has gone up 36 percent during the same time period. More people working at higher wages has led to home price increases.
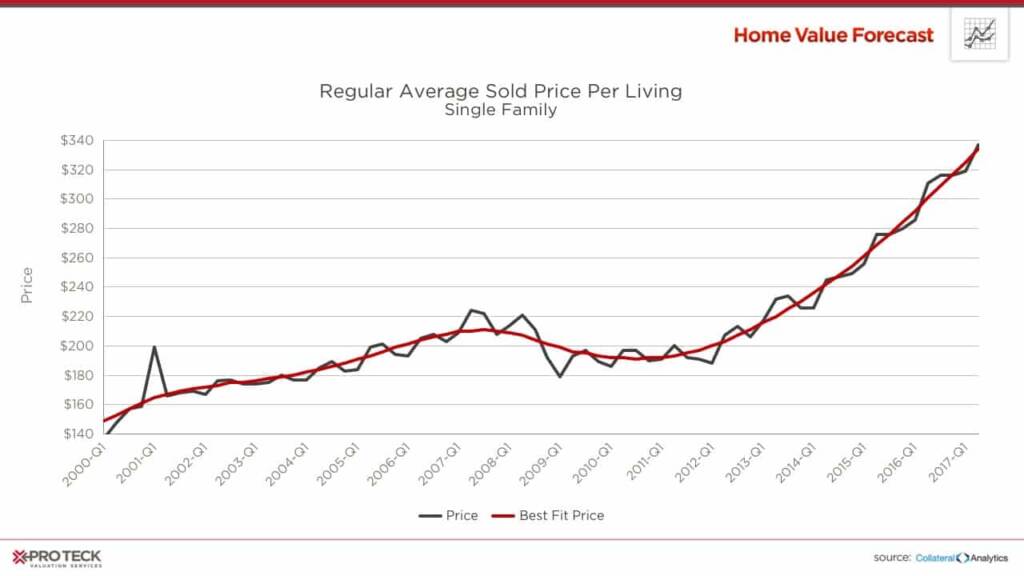
Home prices on a cost-per-square-foot basis have taken off, now averaging over $300 per square foot — meaning an average 2,000-square-foot home now exceeds $600,000.
And as we’ve seen in other markets, there are few houses to be had, with Months of Remaining Inventory at 2.23 overall, and even less at the lower end of the market. However, there is hope that a newly enacted state law and a city affordable housing initiative may help ease the limited housing inventory situation.
The Lower End of the Market
In many cities, condos provide a lower-cost housing alternative for buyers. Unfortunately, the development of for-sale condos in Denver has declined 53 percent over the last five years. In all, condos represent less than 3 percent of all housing starts in metro Denver compared to 20 percent a decade ago.
Fears surrounding how building defects were litigated has hampered the development of for-sale condos, with many builders opting to develop rental properties instead. In late May of this year, Colorado Gov. John Hickenlooper signed into law House Bill 1279, a measure that makes it more difficult to file construction-related lawsuits against condo builders. It is hoped that this law will spur building of more affordable condos and help cool rising real estate prices.
Also in 2017, Denver earmarked $150 million over the next decade for affordable housing, funded by property taxes and new development impact fees. The Affordable Housing Fee ranges from $0.40 to $1.70 per square foot of development. Property tax bills would see a modest increase, an additional $12 per year for the owner of a $300,000 home. This money has been earmarked to support the development and preservation of affordable housing.
Is This a Bubble?
So, what does this all mean? Tight markets and increasing prices have a negative impact on affordability — as calculated by examining the median income for a particular area in relation to the mortgage payment needed to purchase a median priced home. An index score above 100 signifies that a household earning the median income has more than enough income to afford the mortgage. Lower scores suggest more income is needed to cover mortgage expenses. The Collateral Analytics Affordability Index used by Home Value Forecast also looks at loan-to-value norms for a particular area to adjust for more affluent buyers usually putting more money down.
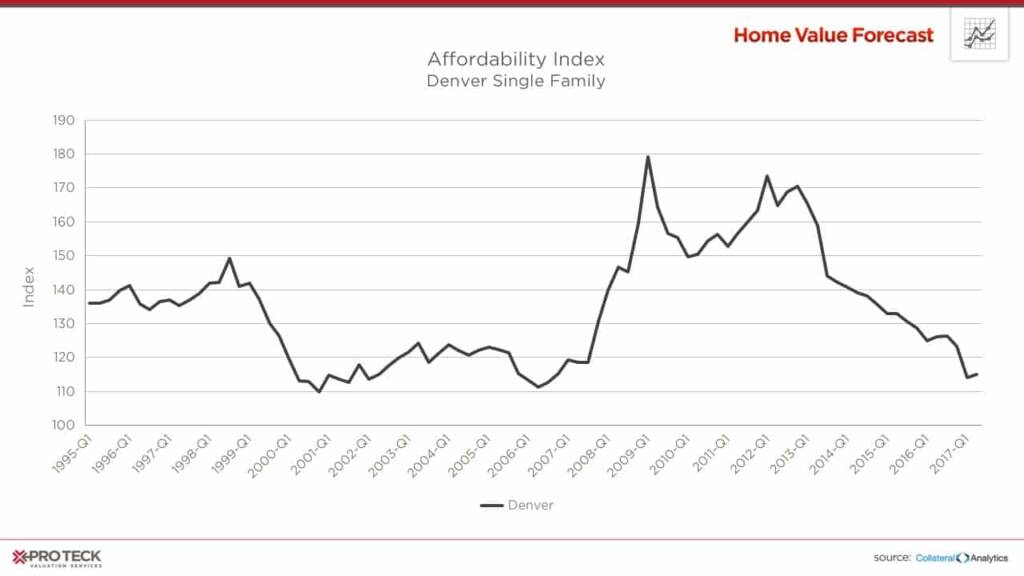
Denver’s Affordability Index is back to pre-crash, 1999-2007 levels, around 120, still more affordable than the 100 threshold — meaning there is more room for home price appreciation.
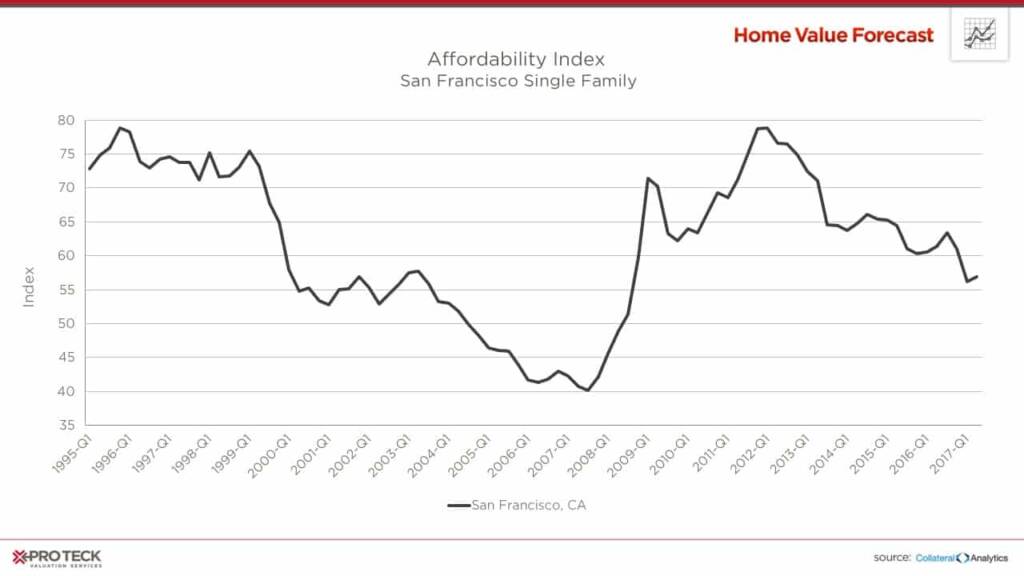
As a comparison, below is San Francisco’s Index, where you can clearly see the “bubble” in 2007 when affordability dipped to 40:
We will keep an eye on the Denver market to see how it progresses, but we do not see an imminent bubble.
CBSA Winners and Losers
Each month, Home Value Forecast uses a number of leading real estate market-based indicators to rank the single-family home markets in the top 200 CBSAs and highlight the strongest and weakest metros.
The ranking system is purely objective and is based on directional trends. Each indicator is given a score based on whether the trend is positive, negative or neutral for that series. For example, a declining trend in active listings would be positive, as will be an increasing trend in average price. A composite score for each CBSA is calculated by summing the directional scores of each of its indicators. From the universe of the top 200 CBSAs, each month we highlight the CBSAs that have the highest and lowest composite scores.
The tables below show the individual market indicators that are being used to rank the CBSAs, along with the most recent values and the percent changes. We have color-coded each of the indicators to help visualize whether it is moving in a positive (green) or negative (red) direction.
Top 10 CBSAs
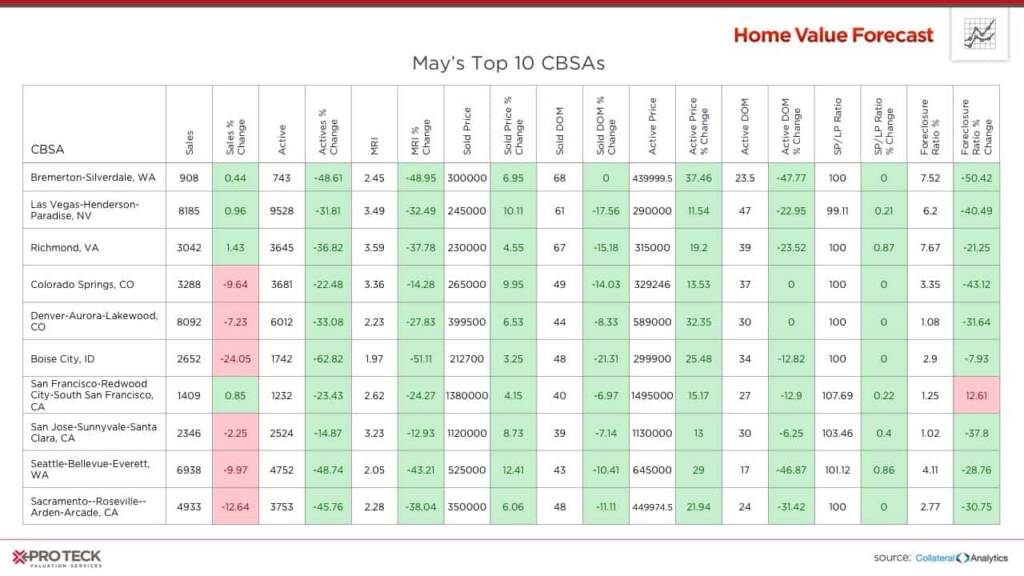
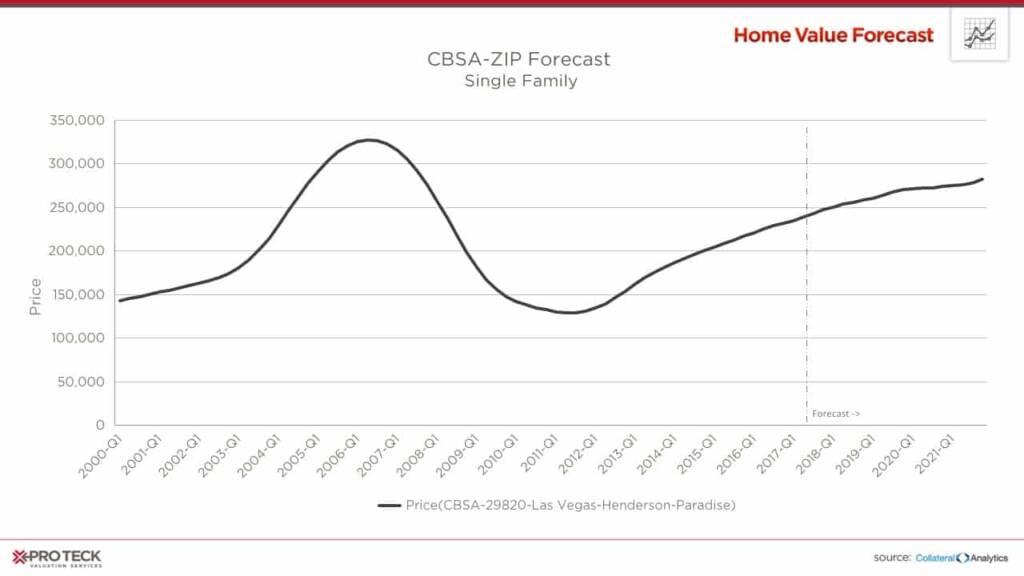
The Las Vegas real estate market appears to be on the mend, with positive trends that include foreclosures as a percent of sales under 10 percent. While prices are rebounding, average Vegas sale prices are still $80,000 below pre-crash levels.
Bottom 10 CBSAs
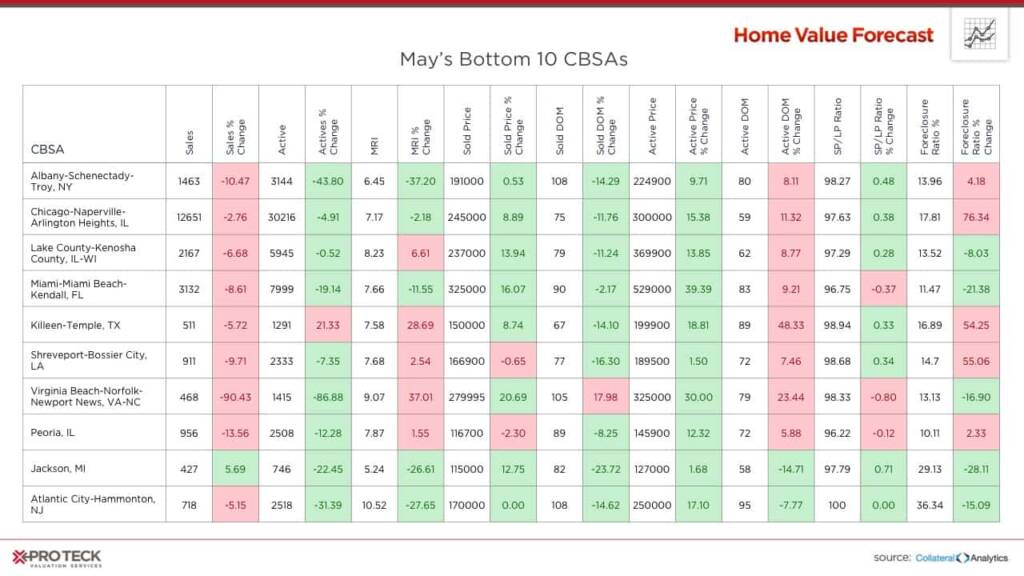
Miami saw its foreclosures as a percent of sales drop by more than 21 percent, to 11.47 percent. With foreclosures accounting for increasingly fewer sales, we see a brighter future for single-family home sales in Miami.
About Home Value Forecast
Home Value Forecast (HVF) is brought to you by SVI. HVF provides insight into the current and future state of the U.S. housing market, and delivers 14 market snapshot graphs from the top 30 CBSAs.
HVF is built using numerous housing and economic data sources. The top 750 CBSAs as well as data down to the ZIP code level for approximately 18,000 ZIPs are available with a corporate subscription to the service.
Also, SVI offers reporters the following:
- National, regional or metro level housing data
- Monthly updates and HVF insights articles
- By-request data for your story — custom data, heat maps and charts are available
- Expert commentary from Home Value Forecast Editorial Committee:
- Tom O’Grady, Chief Executive Officer, Pro Teck Valuation Services
- Michael Sklarz, Ph.D., President, Collateral Analytics
- Jeff Dickstein, Chief Compliance Officer, Pro Teck Valuation Services