Home Value Forecast
Home Value Forecast: Cost of Owning a Condo Comparable to Paying College Dorm Fees in Certain Metros
September is the time for college students to move back to school. And going back to school can be pretty pricey, as the cost of college tuition has continued to grow. Also growing at an alarming rate are room and board fees.
Some parents, wanting to make student housing an investment rather than a cost, are opting to purchase a condo for their child to use during college.
Why Buying Can Make More Sense than Depending on the Dorms
The thought process behind this phenomenon is simple — buy a place, have the student rent out an extra bedroom to a buddy and have an appreciating investment that can be sold once he or she graduates. In this scenario, condominiums make more sense than buying a home, seeing as many college-age students struggle with even the most basic home maintenance tasks and condos typically include condo fees that cover maintenance and upkeep.
A recent article in the The Chicago Tribune entitled “Dorm days are over? Some parents buy condos, houses for students” shows this idea is in fact very much a reality in some areas of the country:
“For several years, we saw an uptick in renting apartments for college students instead of putting them in dorms, which cost so much more now,” said Heather Gustafson, a broker with @properties in Chicago and member of the board of directors of the Chicago Association of Realtors. “Now, many parents say buying a home — condo or house — can cost less than renting or paying for a dorm. And they have a place to stay when they visit their son or daughter.”
But does this approach to achieving housing in academia make sense?
Cost Comparison: College Housing Fees vs. Owning a Condo
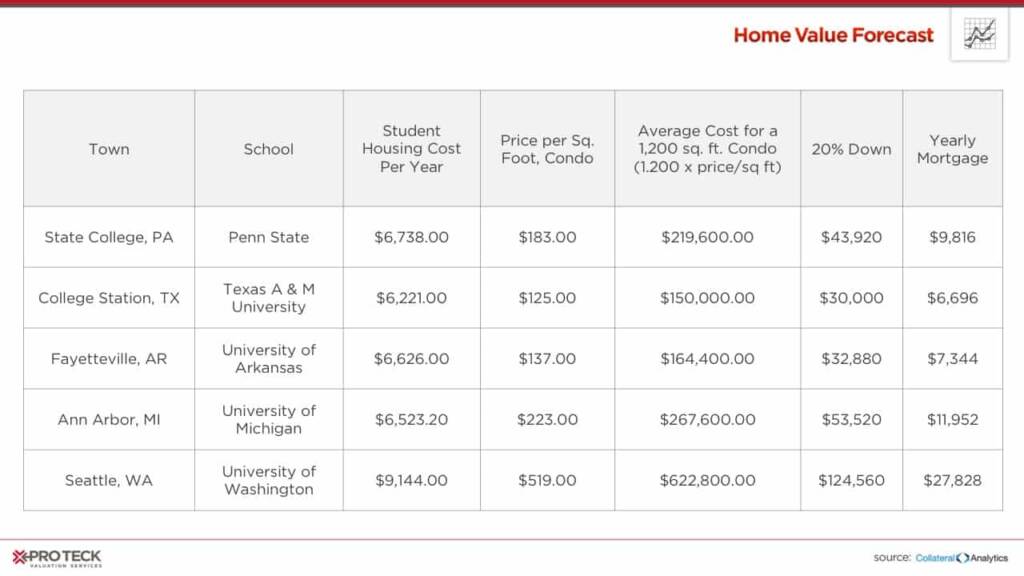
We at Home Value Forecast did a little digging this month, and watched a bunch of college football. We decided to look at what would it cost to buy a 1,200-square-foot condo in a few metros; to add a little local flavor, we added the name of a school in each city.
Our analysis took the average condo selling price per square foot for each city and multiplied it by 1,200 to come up with the average purchase cost. We also added what the yearly mortgage cost would be, assuming 30-year mortgage and a 20% down payment was made for each. For student housing cost we used published rates. If room and board were billed together, we took 60% of that number.
Here are a few highlights from our analysis:
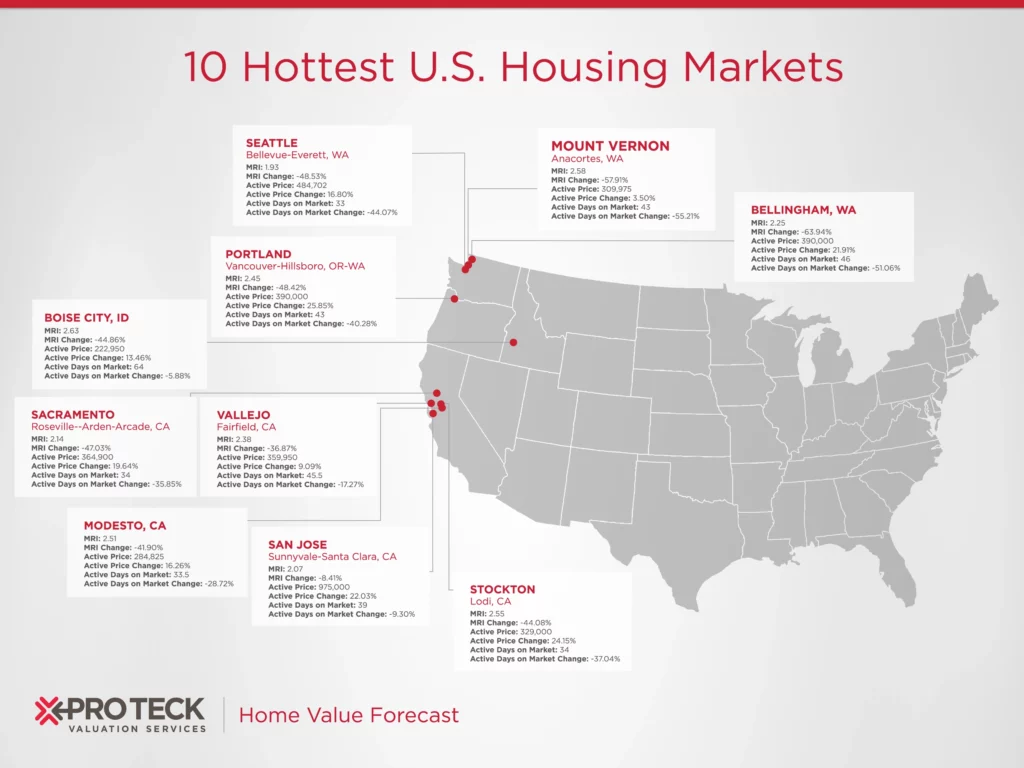
- Seattle, WA, was the most expensive, coming in at $519 per square foot and over $622,000 for a 1,200-square-foot condo.
- College Station, TX, was the lowest, at $125 per square foot and $150,000 to buy the condo.
- Seattle had the largest gap between housing fees and buying, with the mortgage costing three times more. Also, the down payment could be prohibitive.
Looking at monthly mortgage estimates if factoring in a 20% down payment, buying a condo in College Station comes closest to being cost neutral, $6,696 in mortgage payments versus $6,221 for student-housing fees, aka “rent” per year. Taxes, condo fees, insurance and utilities could be offset by having a tenant pay $500/month, which would still be below university housing fees.
So which option is best for you? If your child gets a paying tenant and you are fortunate enough to have the down payment available, purchasing in College Station, TX, (Texas A&M) or Fayetteville, AR, (University of Arkansas) could save you money in the short-term and provide a longer-term investment.
The average home in the U.S. sells in the low $200,000 range – but if your child goes to the University of Washington and you’re considering buying in the Seattle metro, it will cost you more than three times as much to purchase a condo. At that price, it probably makes more sense for most parents to simply pay the dorm fees.
CBSA Winners and Losers
Each month, Home Value Forecast uses a number of leading real estate market-based indicators to rank the single-family home markets in the top 200 CBSAs and highlight the strongest and weakest metros.
The ranking system is purely objective and is based on directional trends. Each indicator is given a score based on whether the trend is positive, negative or neutral for that series. For example, a declining trend in active listings would be positive, as would an increasing trend in average price. A composite score for each CBSA is calculated by summing the directional scores of each of its indicators. From the universe of the top 200 CBSAs, each month we highlight the CBSAs that have the highest and lowest composite scores.
The tables below show the individual market indicators that are being used to rank the CBSAs, along with the most recent values and the percent changes. We have color-coded each of the indicators to help visualize whether it is moving in a positive (green) or negative (red) direction.
Top 10 CBSAs
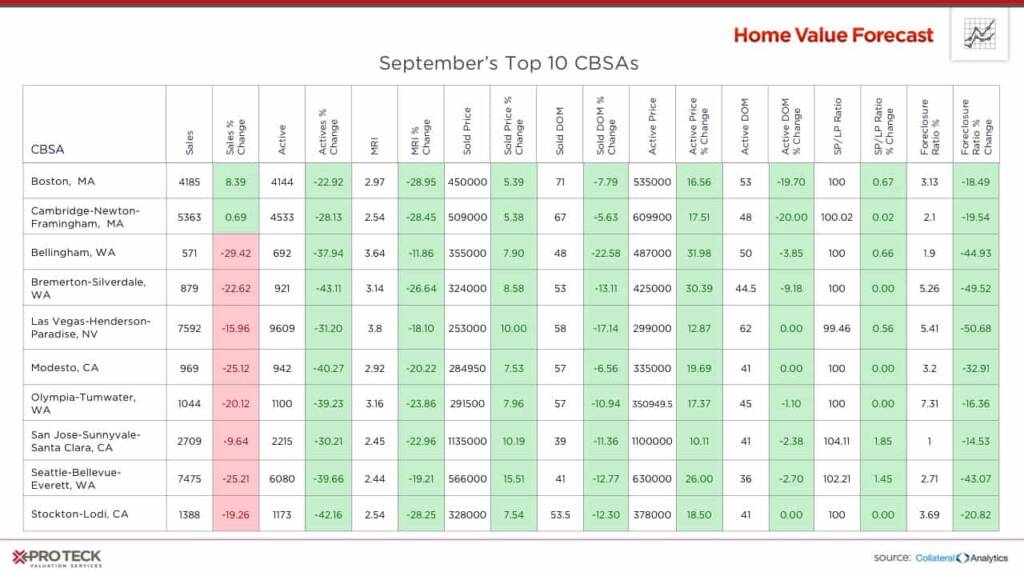
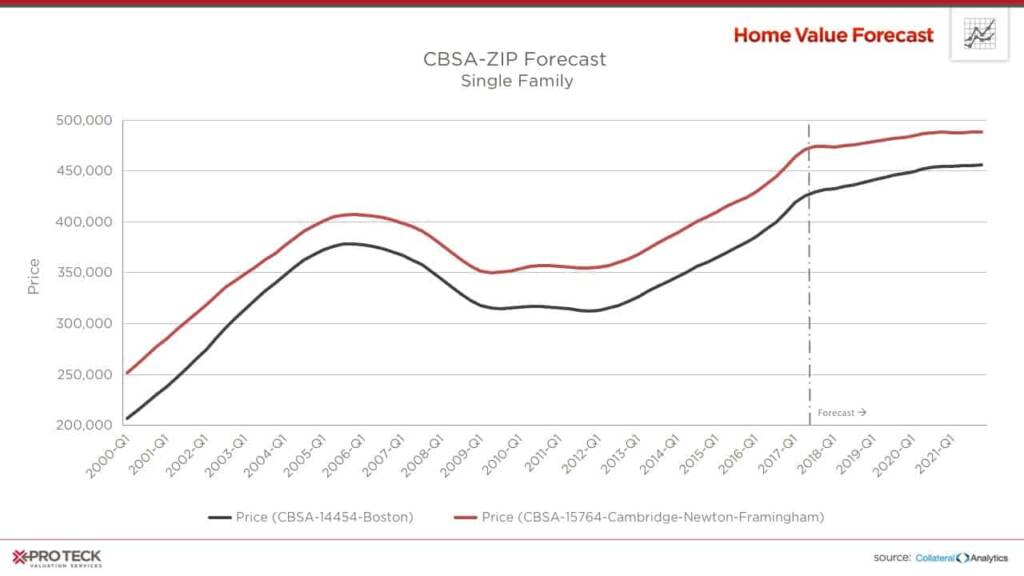
It’s not often we have two CBSAs separated by a river at the top of our listing. Both the Boston and Cambridge CBSAs low inventory is leading to increasing prices, which is not expected to change anytime soon.
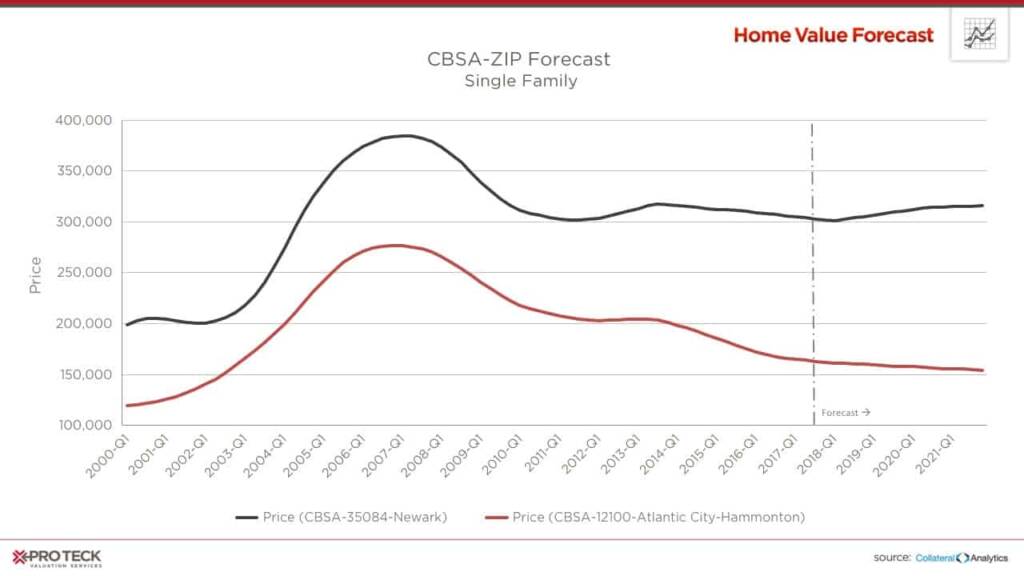
Bottom 10 CBSAs
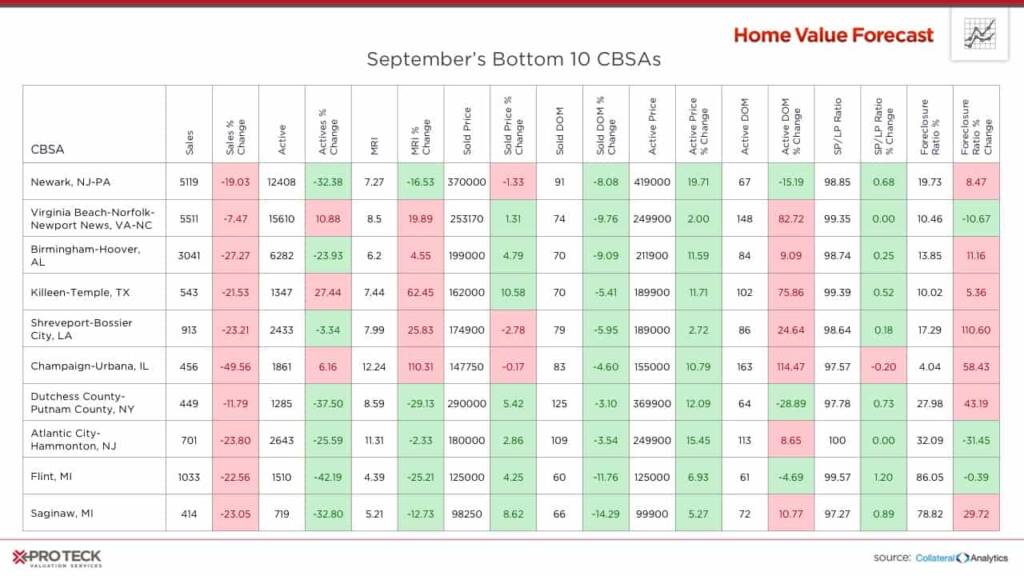
For the Bottom 10, Newark and Atlantic City CBSAs stand out, unfortunately not in a good way. Home prices are at 2003-2004 levels, with little appreciation on the horizon.
About Home Value Forecast
Home Value Forecast (HVF) is brought to you by SVI. HVF provides insight into the current and future state of the U.S. housing market, and delivers 14 market snapshot graphs from the top 30 CBSAs.
HVF is built using numerous housing and economic data sources. The top 750 CBSAs as well as data down to the ZIP code level for approximately 18,000 ZIPs are available with a corporate subscription to the service.
Also, SVI Valuation Services offers reporters the following:
- National, regional or metro level housing data
- Monthly updates and HVF insight articles
- By-request data for your story — custom data, heat maps and charts are available
- Expert commentary from Home Value Forecast Editorial Committee:
- Tom O’Grady, Chief Executive Officer, Pro Teck Valuation Services
- Michael Sklarz, Ph.D., President, Collateral Analytics
- Jeff Dickstein, Chief Compliance Officer, Pro Teck Valuation Services