Home Value Forecast
2014 Year in Review – Home Value Forecast
This month’s Home Value Forecast looks back at trends over the past twelve months in a number of residential real estate categories that best predict a recovering housing market. We will list the top three CBSAs in Current Sales Price, Twelve Month Active List Price Appreciation, Current Months of Remaining Inventory and Twelve Month Sales Price Appreciation. We will also look back at our “Top Threes” from last year and see how they are doing today.
Happy Holidays from all of us at SVI, and here’s to more positive real estate trends in 2015!
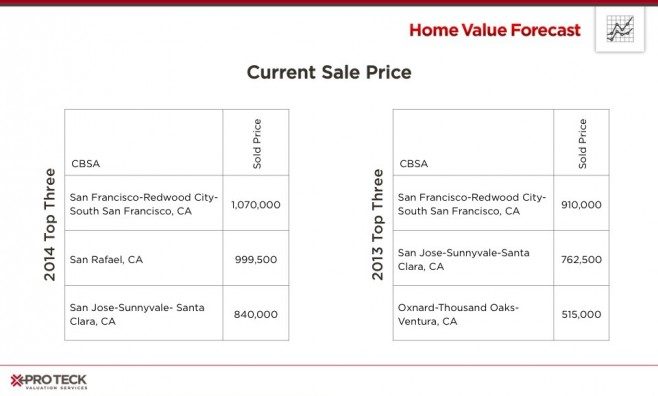
Current Sale Price
California continues to lead the nation in average single family home sale price, with San Francisco once again number one with an average sale price of more than one million dollars. San Rafael and San Jose, California round out the top three. Oxnard, California, number three last year, fell to number eight in 2014.
California CBSAs accounted for twelve of the top thirteen spots in this category, with Honolulu, HI (number four) being the lone exception.
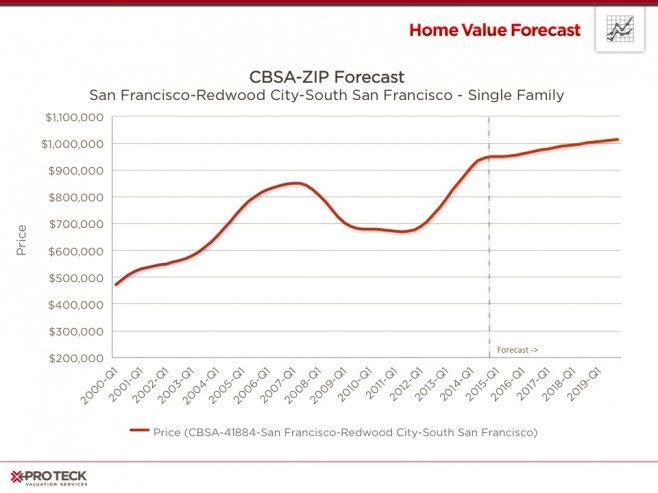
We anticipate California will continue to lead the country into 2015, but the rate of increase should level out as can be seen by this Collateral Analytics Home Price Forecast for San Francisco:
Twelve-Month Active List Price Appreciation
“Active price” is the median price a home is listing for at a moment in time. We like to look at list price as a good reflection of the health of a market, because it takes into account people’s perceptions of where prices are headed.
The good news is that markets that were hit hard by the housing crash are leading this list in 2014. Florida and Detroit markets have been in our “Bottom Ten” list for many months — mostly because of the number of foreclosure sales causing drag on the recovery. It’s refreshing to see that these markets may be on their way to recovery.
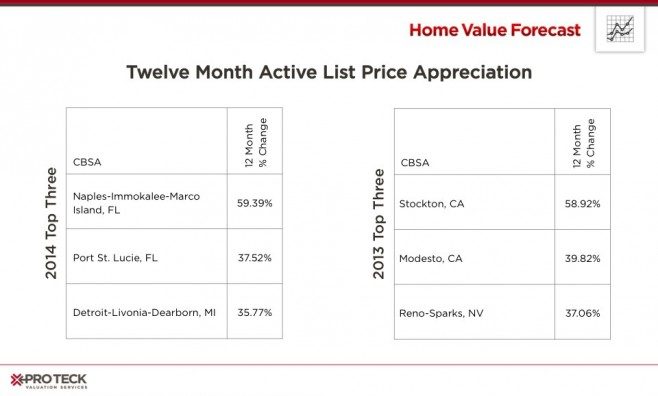
We saw similar active list price appreciation ranges last year but in very different markets. This year our 2013 leaders: Stockton (#93, 7.38%), Modesto (#137, 3.88%) and Reno (#39, 12.89%) have slowed to more modest levels of appreciation.
Current Months of Remaining Inventory (MRI)
MRI is another indicator that shows how “hot” a market is at a particular time. MRI equals the amount of households on the market divided by the number that sell per month. If an area has a high MRI (let’s say 10 months), it means that the market is saturated — a buyer’s market. If MRI is low (below 3 months) then it becomes a seller’s market. A “balanced” market will have approximately six months of inventory at any given time.
Today, the top three markets are in California, all with less than two months inventory – leading to fierce competition for homes and many selling for above asking price.
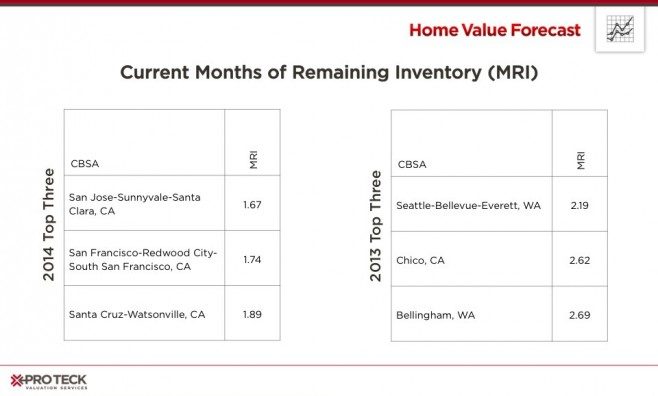
Our 2013 leaders are still hot markets with Seattle (2.38), Chico (3.39) and Bellingham (3.18) continuing to experience a limited housing supply.
Twelve-Month Sales Price Appreciation
Sales price appreciation is a good thing, but the statistic by itself can be deceiving. Our top three for the year all had more than twenty percent appreciation for the year, yet all were decimated by the housing crisis. What these numbers reflect is that the market has responded to the bargains that are out there, and that the housing market has begun to reflect supply/demand fundamentals.
It is interesting to note that none of the top three this year are anywhere close to the levels of appreciation seen at this time last year, again showing that the worst of times are behind us and the recovery is well on its way.
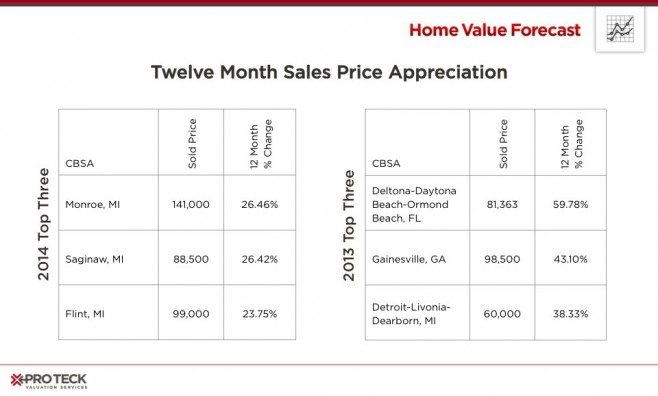
Of the 200 markets we track at Home Value Forecast, only twenty-two had a negative change in average sold price in 2014, and only four had a negative change of more than five percent.
Here’s to positive developments continuing in 2015 and beyond!
CBSA Winners and Losers
Each month, Home Value Forecast uses a number of leading real estate market-based indicators to rank the single-family home markets in the top 200 CBSAs to highlight the strongest and weakest metros.
The ranking system is purely objective and is based on directional trends. Each indicator is given a score based on whether the trend is positive, negative or neutral for that series. For example, a declining trend in active listings would be positive, as will be an increasing trend in average price. A composite score for each CBSA is calculated by summing the directional scores of each of its indicators. From the universe of the top 200 CBSAs, we highlight each month the CBSAs which have the highest and lowest composite scores.
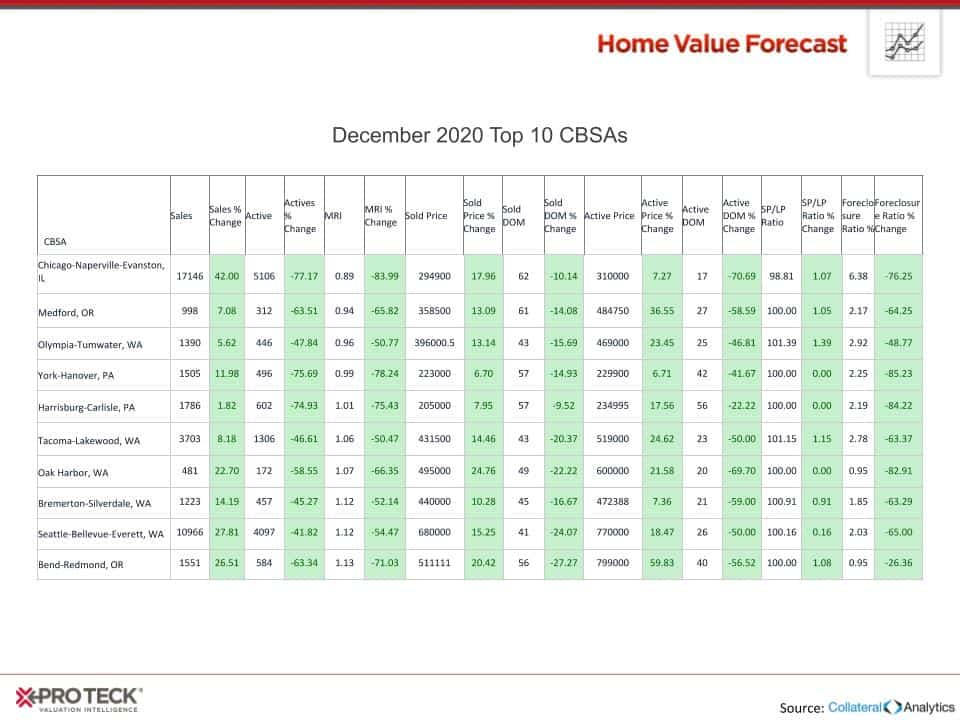
The tables below show the individual market indicators that are being used to rank the CBSAs along with the most recent values and the percent changes. We have color coded each of the indicators to help visualize whether it is moving in a positive (green) or negative (red) direction.
Top 10 CBSAs
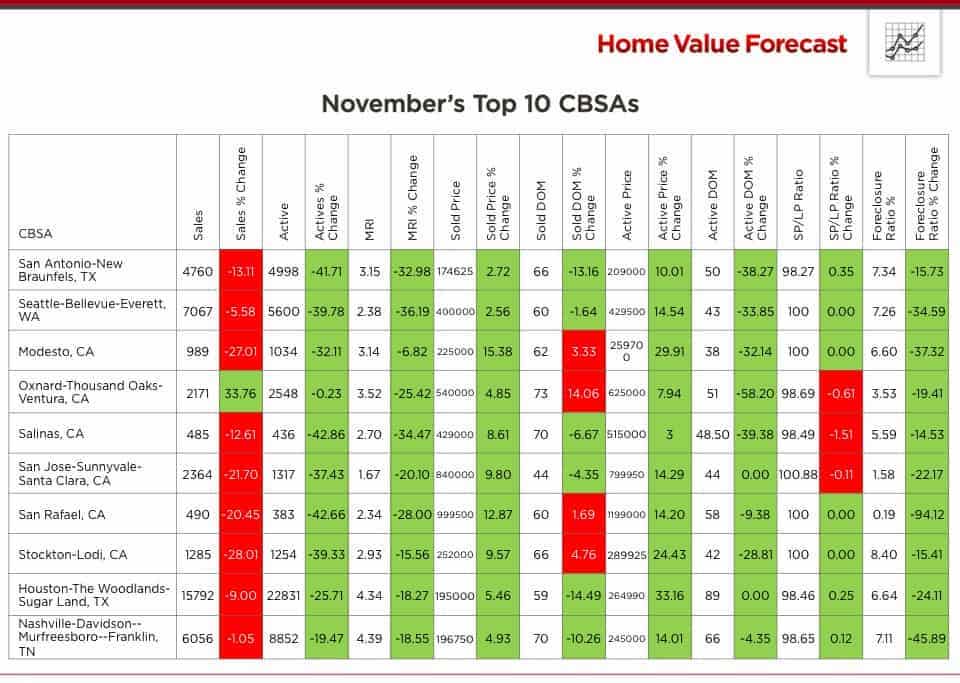
Wrapping up the year, San Francisco and San Rafael, CA as well as Seattle, WA were each featured in the top ten for six months of the year. Houston, San Antonio and Lubbock, TX also had strong indicators and were featured in the top ten five times throughout the year.
Bottom 10 CBSAs
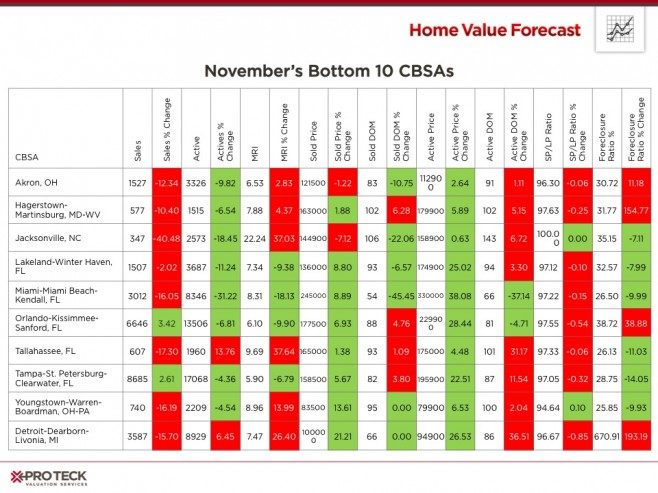
Taking a look over the last year, Lakeland-Winter Haven, FL has been listed in the bottom 10 eight times. Also, Jacksonville, NC and Tampa, FL metro areas have been included in the bottom ten in seven months this year. Tampa and Lakeland have seen their indicators improve, especially MRI. However, Jacksonville, NC’s MRI has increased to 22.24 indicating it is still a weak market and has a ways to go in terms of housing recovery.