Home Value Forecast
NYC’s Millennial Moneymakers Choosing Bronxville, NY over Greenwich CT Housing Market
In September, an article in Bloomberg stated that Greenwich, CT was the worst U.S. housing market. That article, plus a follow-up piece discussed how today’s younger generation of “the Wall Street crowd” are more frugal, and are looking to live within their means. This has lead to a “hot” housing market in Greenwich for houses below $2 million, but a stagnant market for upper tiers.
The Bronxville, NY, housing market on the other hand, is thriving. With great schools, walkable town center and “New England” feel, Bronxville has become a “go-to neighborhood” for many millennials leaving New York City.
Greenwich and Bronxville are both known as wealthy communities that attract New York City workers – one big difference is the commute. Long gone are the days of Mad Men, when Don Draper would drive on a deserted highway home after work. Today, the commute from Bronxville (15 miles) or Greenwich (34 miles) to mid-town Manhattan can be a grind. Fortunately, both communities have rail service to the city but the train commute to Bronxville is quicker (30 minutes versus 50+) and easier to handle.
The old status symbol used to be a large house on a private lot in the suburbs. But as we have discussed in past Home Value Forecasts, that is no longer the dream. Today, a lesser commute, better amenities within walking distance and a sense of community are what is now desired. These are some of the reasons that Bronxville, NY is flourishing compared to Greenwich, CT.
A Tale of Two Cities
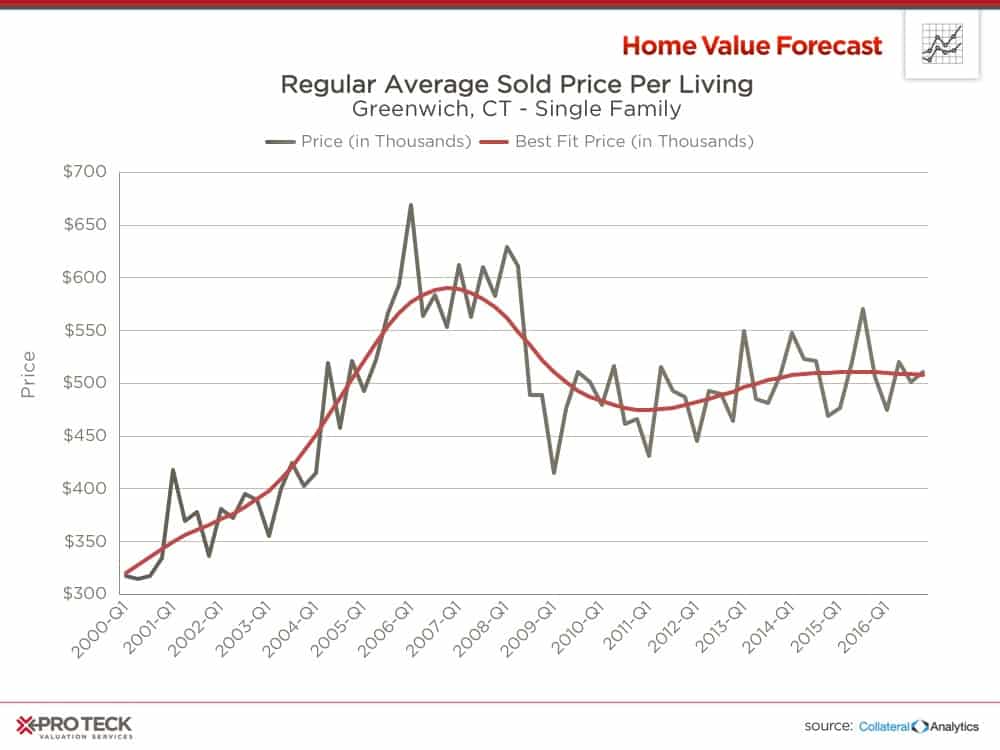
Looking at the average sold price per foot living area, one can see that Greenwich hasn’t rebounded from pre-crash highs. One might say this is a correction from the highs fueled by massive bonuses being paid in the years leading up to 2007.
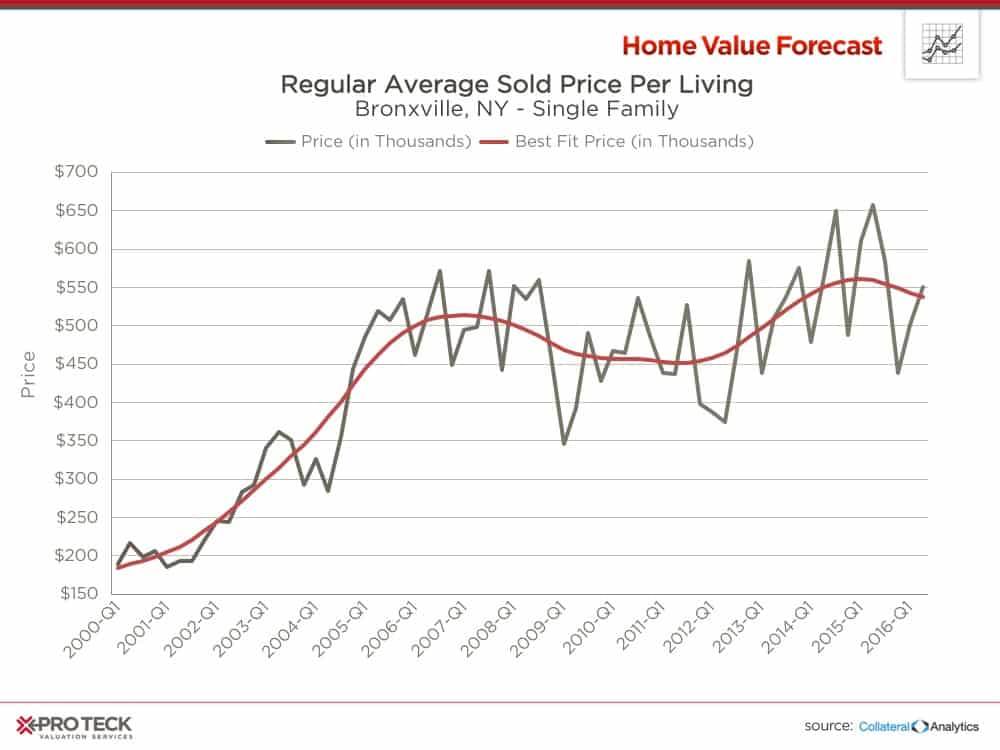
In Bronxville, the effects of the crash were more muted, and the community has surpassed pre-crash highs.
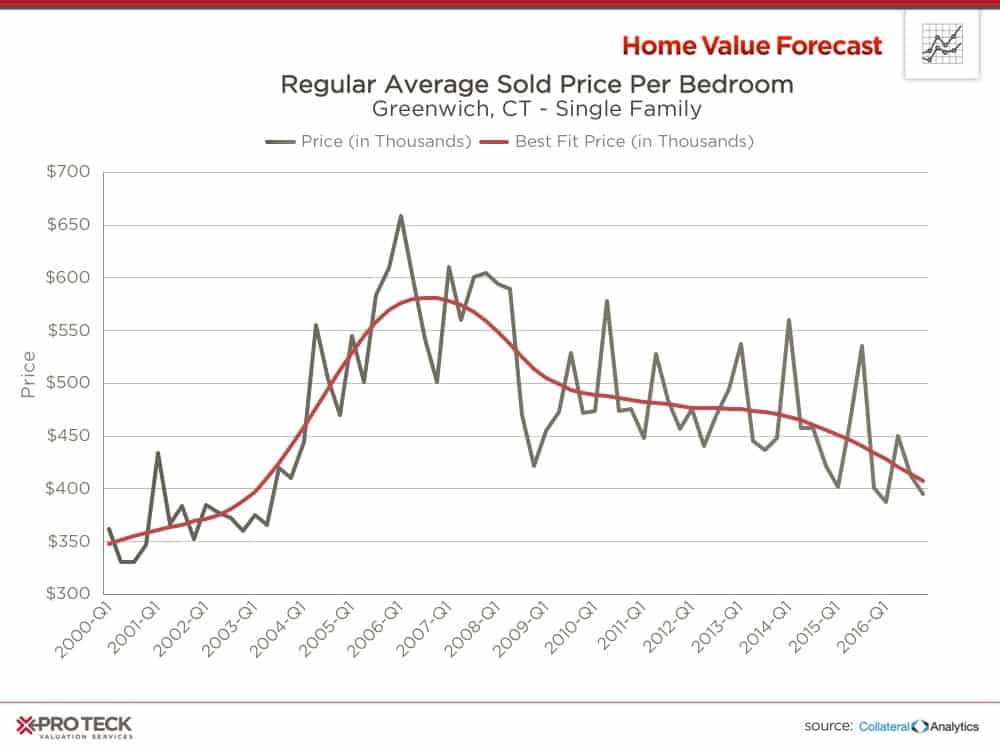
Where the impact of the shift to “smaller” homes closer to the city can be seen most is in sold price per bedroom.
In Bronxville, one sees a pattern that closely resembles the price per square foot graph – a muted downturn after the crash, followed by a rise to new highs.
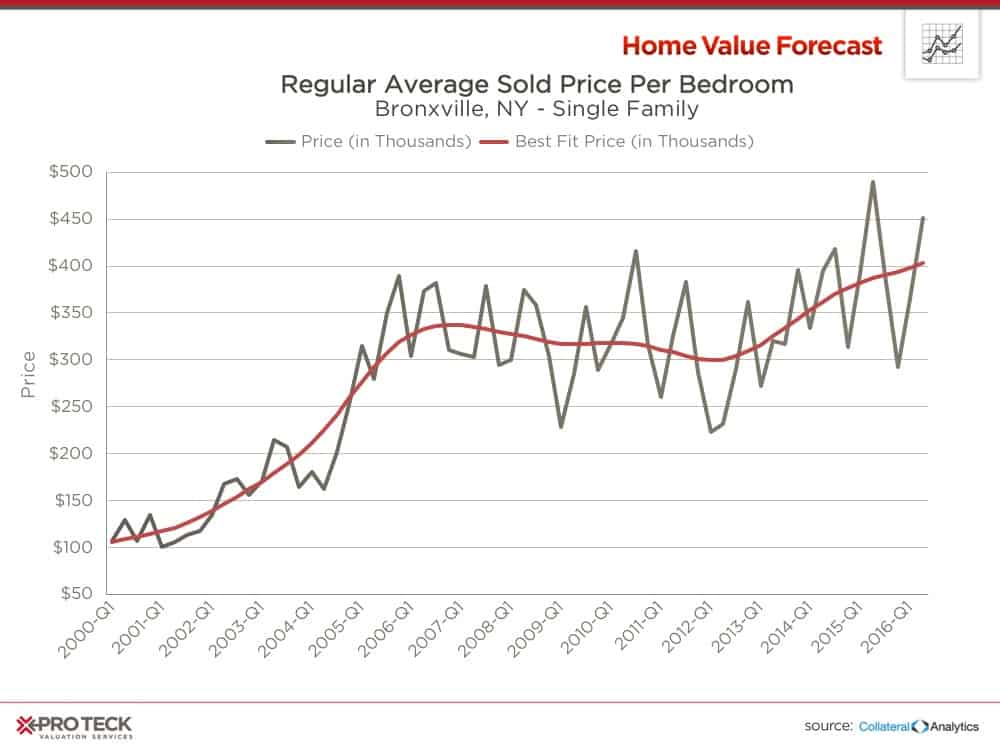
For Greenwich, the downward pressure on the higher end/larger homes on the market makes today’s average sold price per bedroom at a post-crash low, equal to 2002 levels (compared to price per square foot that are equal to 2004 levels).
CBSA Winners and Losers
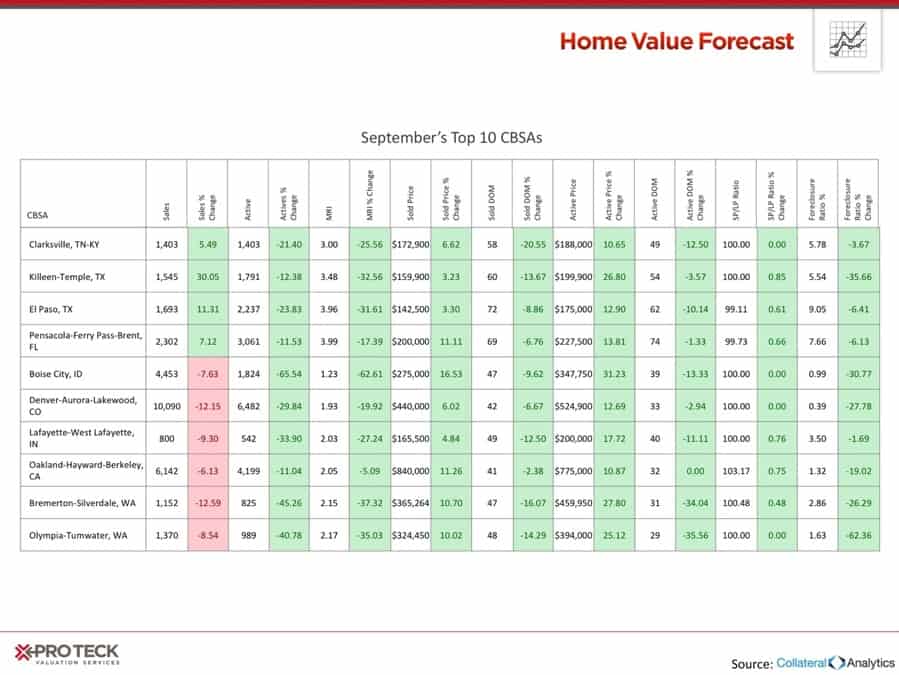
Each month, Home Value Forecast uses a number of leading real estate market-based indicators to rank the single-family home markets in the top 200 CBSAs and highlight the strongest and weakest metros.
The ranking system is purely objective and is based on directional trends. Each indicator is given a score based on whether the trend is positive, negative or neutral for that series. For example, a declining trend in active listings would be positive, as will be an increasing trend in average price. A composite score for each CBSA is calculated by summing the directional scores of each of its indicators. From the universe of the top 200 CBSAs, each month we highlight the CBSAs which have the highest and lowest composite scores.
The tables below show the individual market indicators that are being used to rank the CBSAs, along with the most recent values and the percent changes. We have color-coded each of the indicators to help visualize whether it is moving in a positive (green) or negative (red) direction.
Home Value Forecast Top Ten CBSAs
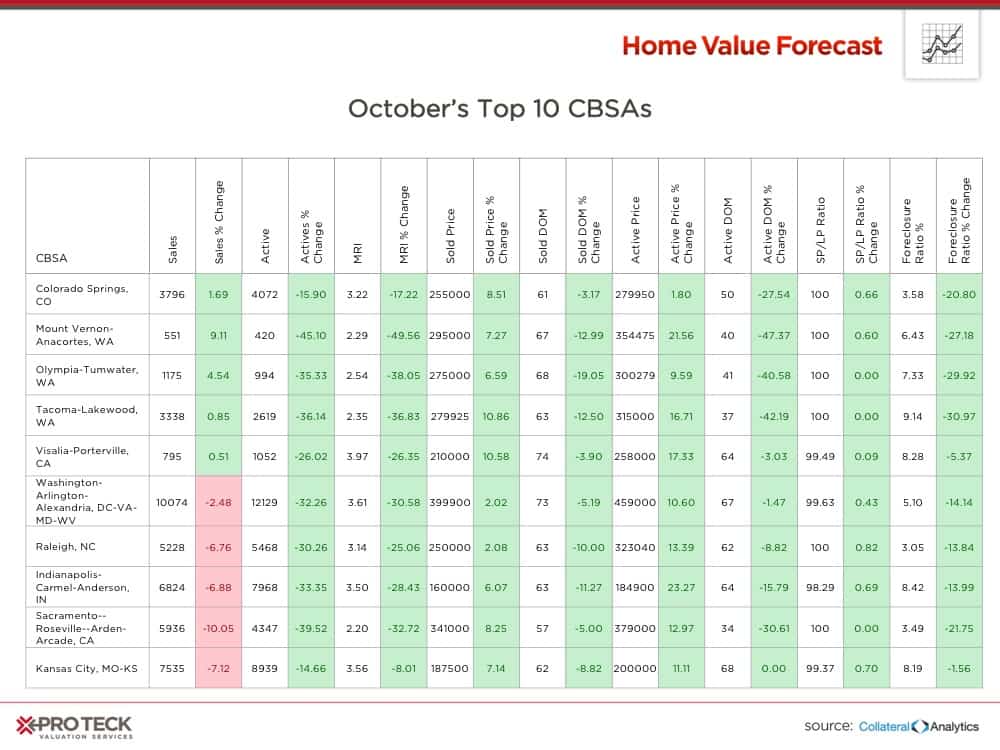
It’s interesting to see the Washington–Arlington–Alexandria, DC-VA-MD CBSA in the Top Ten this month. With President-elect Donald Trump’s victory and the change in Party rule on Capitol Hill, we wonder if there will be an up-tick in active listings. In previous elections, the area hasn’t seen a dramatic impact on real estate – this one may be different if Trump stays true to his promise to bring in more outsiders to “drain the swamp.” We will keep an eye on it.
Home Value Forecast Bottom Ten CBSAs:
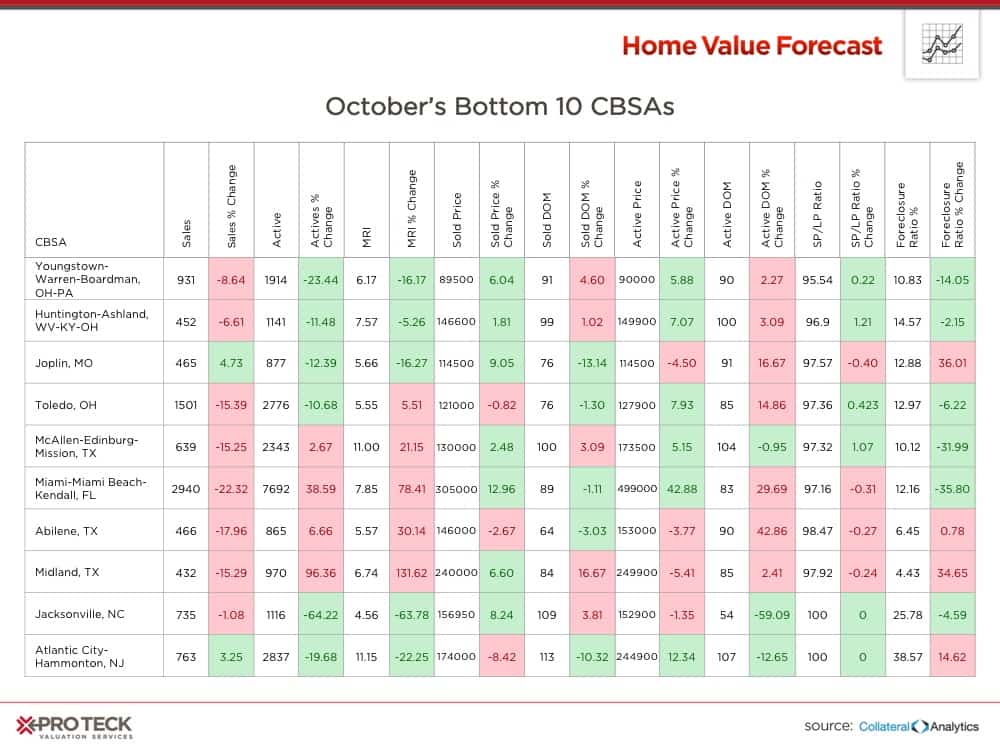
Atlantic City is once again our bottom real estate market in the country. President-elect Trump was part of the rise and fall of Atlantic City, with his companies filing four bankruptcies between 1991 and 2009. The rise of other gambling options, including other casino options closer to people’s homes, online betting and the transformation of Las Vegas into a multi-use destination all played a part in Atlantic City’s demise.
On election day, New Jersey voters rejected a proposal to expand casinos outside of Atlantic City – a day later the state took control of the city. Here’s hoping the area can be revitalized around the seven remaining casinos.
About Home Value Forecast
Home Value Forecast (HVF) is brought to you by SVI. HVF provides insight into the current and future state of the U.S. housing market, and delivers 14 market snapshot graphs from the top 30 CBSAs.
HVF is built using numerous housing and economic data sources. The top 750 CBSAs as well as data down to the ZIP code level for approximately 18,000 ZIPs are available with a corporate subscription to the service.
Also, SVI offers reporters the following:
- National, regional or metro level housing data
- Monthly updates and HVF insights articles
- By-request data for your story — custom data, heat maps and charts are available
- Expert commentary from Home Value Forecast Editorial Committee:
- Tom O’Grady, Chief Executive Officer, Pro Teck Valuation Services
- Michael Sklarz, PH.D., President, Collateral Analytics
- Jeff Dickstein, Chief Compliance Officer, Pro Teck Valuation Services