Home Value Forecast
Hoosier State on the Rebound: Indiana Metros Hit Hardest In Recession Coming On Strong
Each month, HVF’s Housing Market Report uses a number of leading real estate market-based indicators to report on activity in the single-family home markets in the top 200 metropolitan areas (CBSAs) in the U.S.
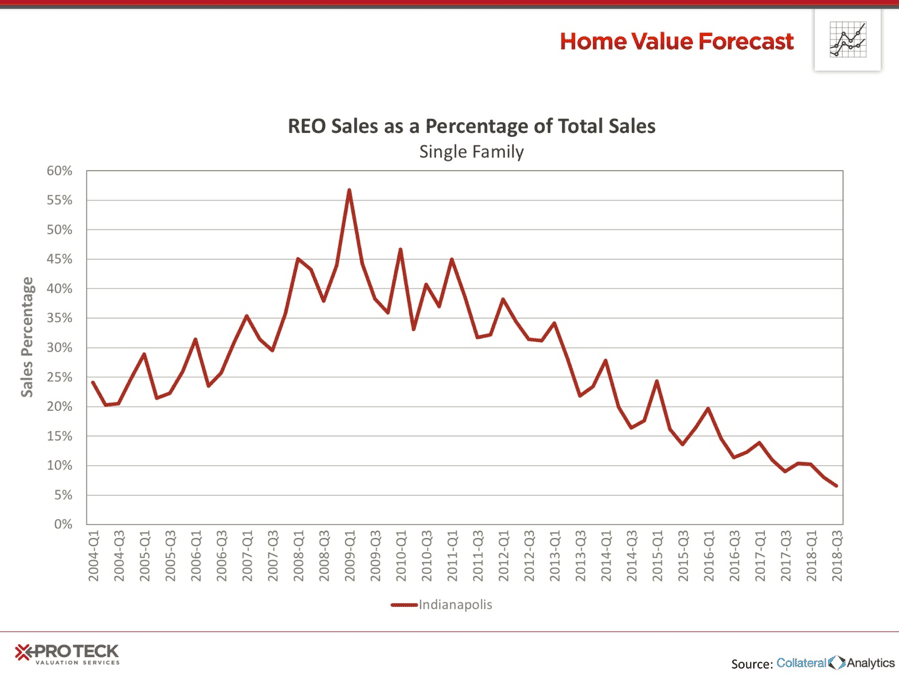
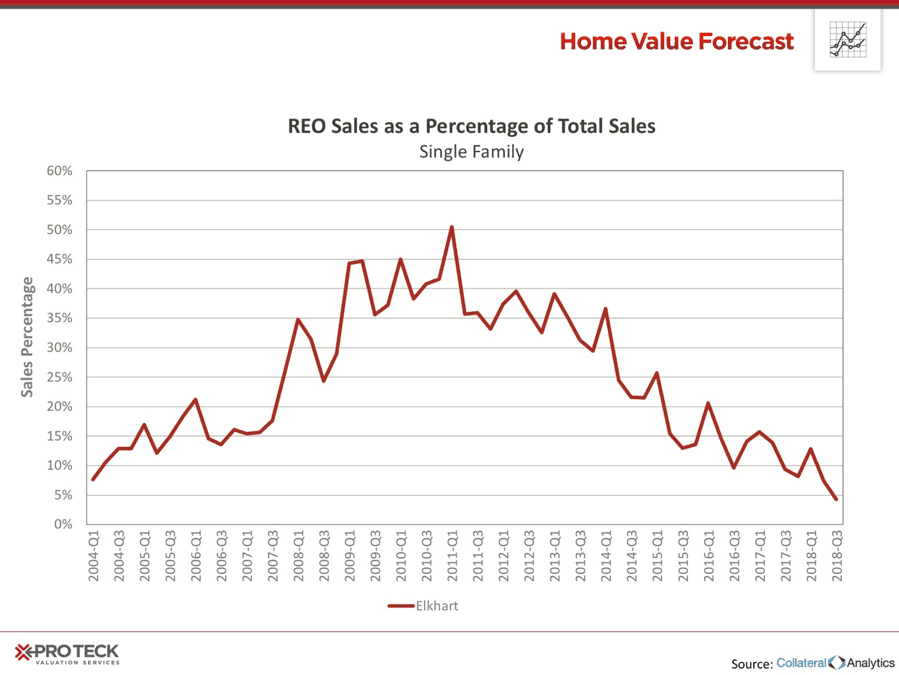
In this month’s Housing Market Report, we take a closer look at the Elkhart and Indianapolis metros in Indiana, both top performers on our Top 10 Hottest Housing Markets. Elkhart had the highest unemployment rate in the country during the Great Recession, which negatively impacted foreclosure rates and the housing market as a whole. As the Hoosier State continues to rebound in the housing and jobs markets, we take a look at what has helped them bounce back, and where the market might be headed in Indiana.
Of our Top 10 housing markets, Elkhart and Indianapolis made major improvements in REO Sales as a Percent of Total Sales, topping out over 50% and now 1.74% and 3.80% respectively. It was reported in 2009 that an estimated 1 in 62 Indiana homes was in some form of foreclosure. Today, that number is 1 in more than 4,700 homes. A market that was once hindered by foreclosures has escaped that burden and is trending upwards.
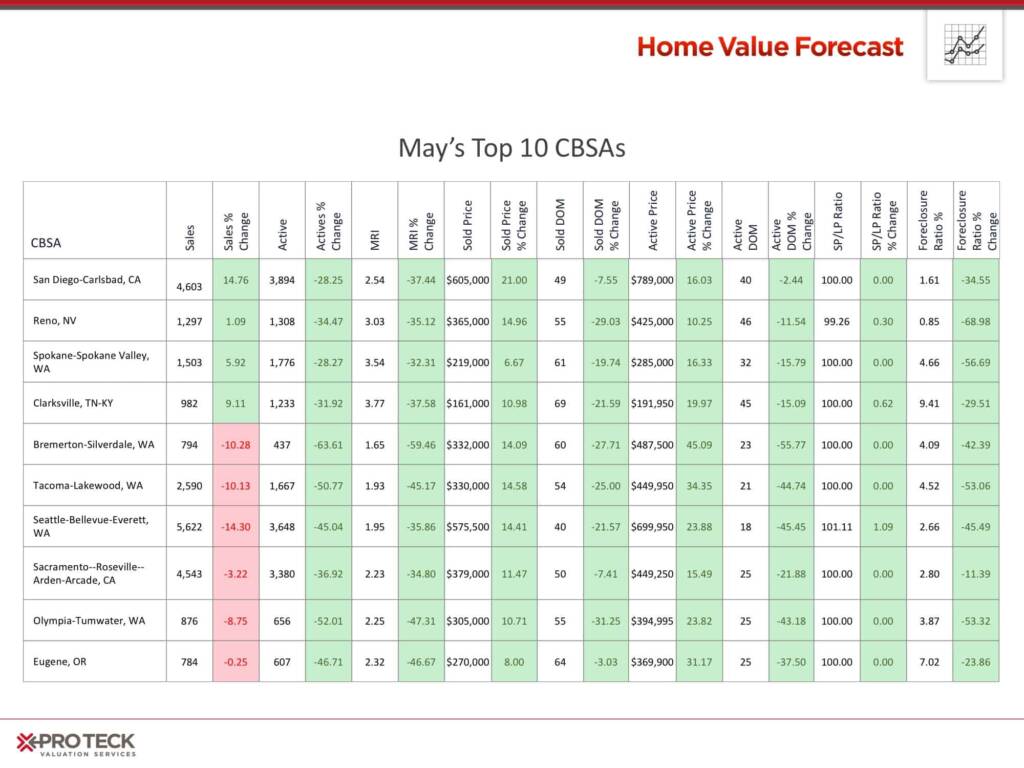
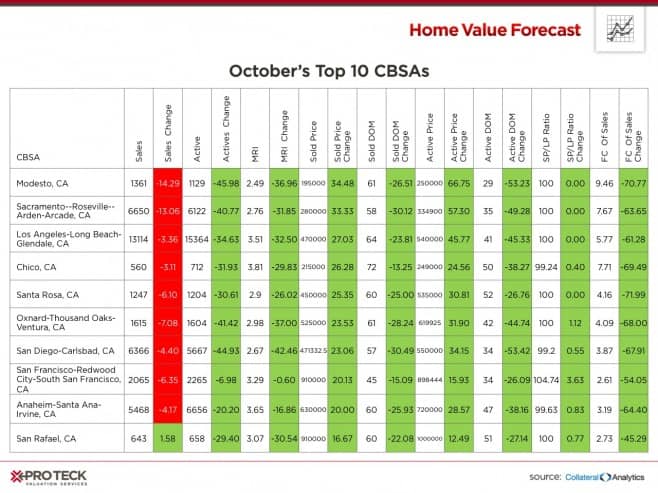
Top Ten:
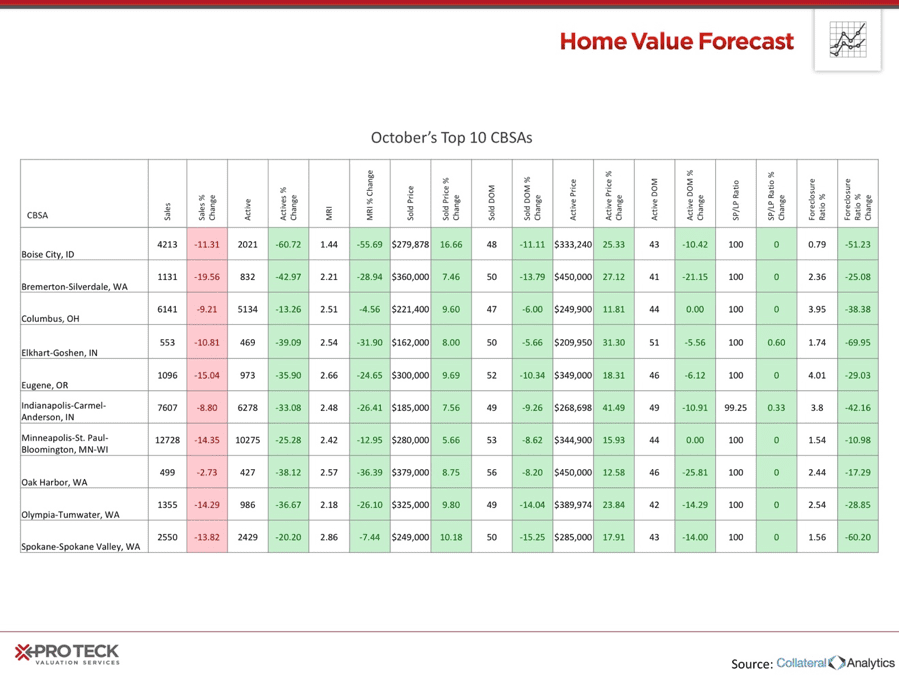
It was reported in 2009 that an estimated 1 in 62 Indiana homes was in some form of foreclosure. Today, that number is 1 in more than 4,700 homes. A market that was once hindered by foreclosures has escaped that burden and is trending upwards.
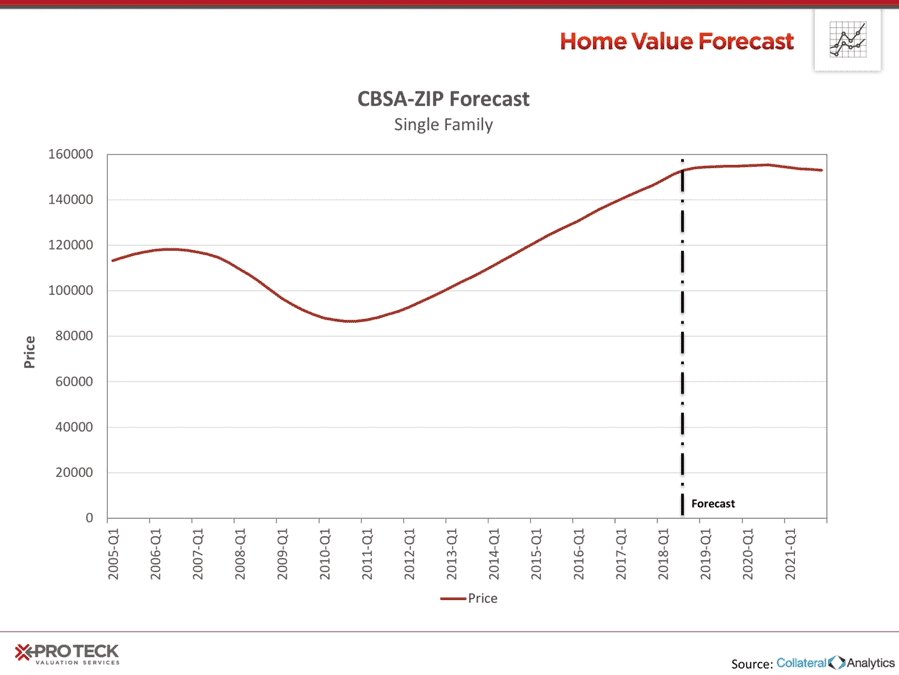
Indiana market forecasts continue to show promising data. The CBSA-Zip Forecast for Elkhart estimates housing prices to continue to trend upwards. Months Remaining Inventory for both Indiana metros on our top 10 are healthy (2.5 for Elkhart and 2.4 for Indianapolis), so we expect the Indiana rebound to continue.
Interested in learning more about the top metros featured in this month’s market report? Contact us for more in-depth information on each CBSA listed in this month’s report.
ABOUT SVI’S MONTHLY HOUSING MARKET REPORT
The Home Value Forecast uses a ranking system that is purely objective and is based on directional trends of nine market indicators. Each indicator is given a score based on whether the trend is positive, negative or neutral for that series. For example, a declining trend in active listings would be positive, as would an increasing trend in average price. A composite score for each CBSA is calculated by summing the directional scores of each of its indicators. From the universe of the top 200 CBSAs, each month we highlight topics and trends in the real estate market.