Home Value Forecast
Home Value Forecast: Traditionally Hot Spring Markets Cooled by COVID-19
Each month, Home Value Forecast uses a number of leading real estate market-based indicators to monitor single-family home market activity in the nation’s top 200+ metropolitan areas (CBSAs) and reports on the Top 10.
The numbers in this report were from the three-month period ending in late April 2020.
THE TOP 10
The Home Value Forecast Top 10 Hottest Housing Markets ranking system is purely objective and is based on directional trends over the past eight quarters. It’s not a listing of what markets are most expensive or most in need of inventory – it ranks market momentum at a specific point in time.
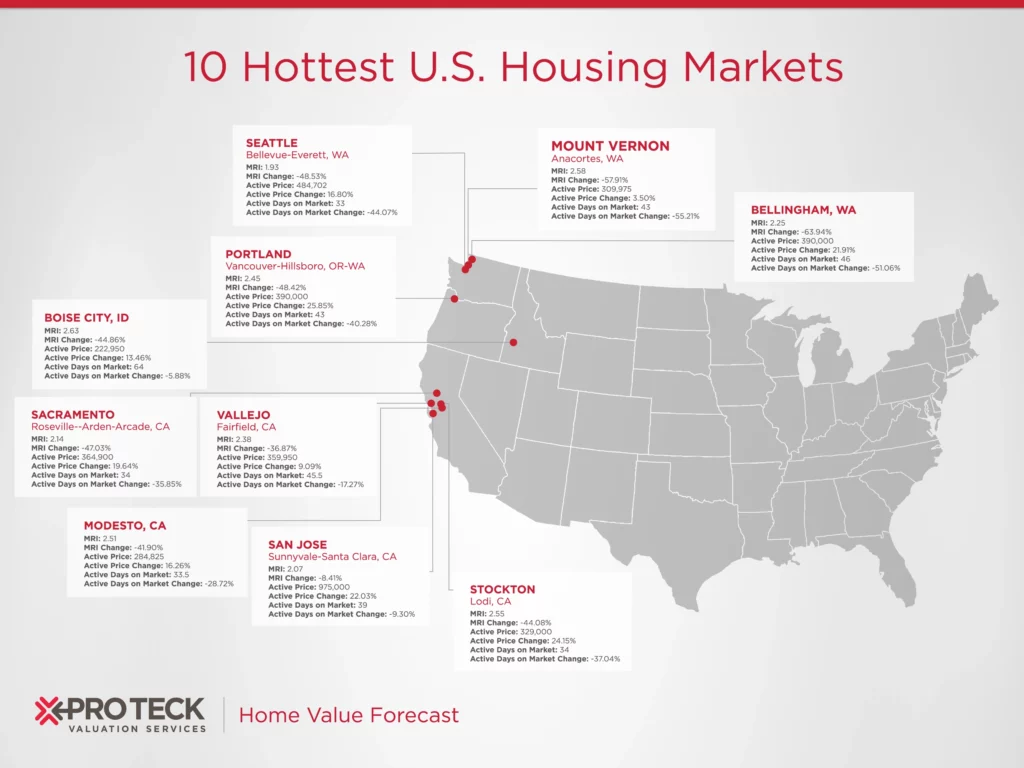
This month’s Top 10 is heavily skewed to the east, with Boise City, ID, and Phoenix, AZ, being the only two metros from the west:
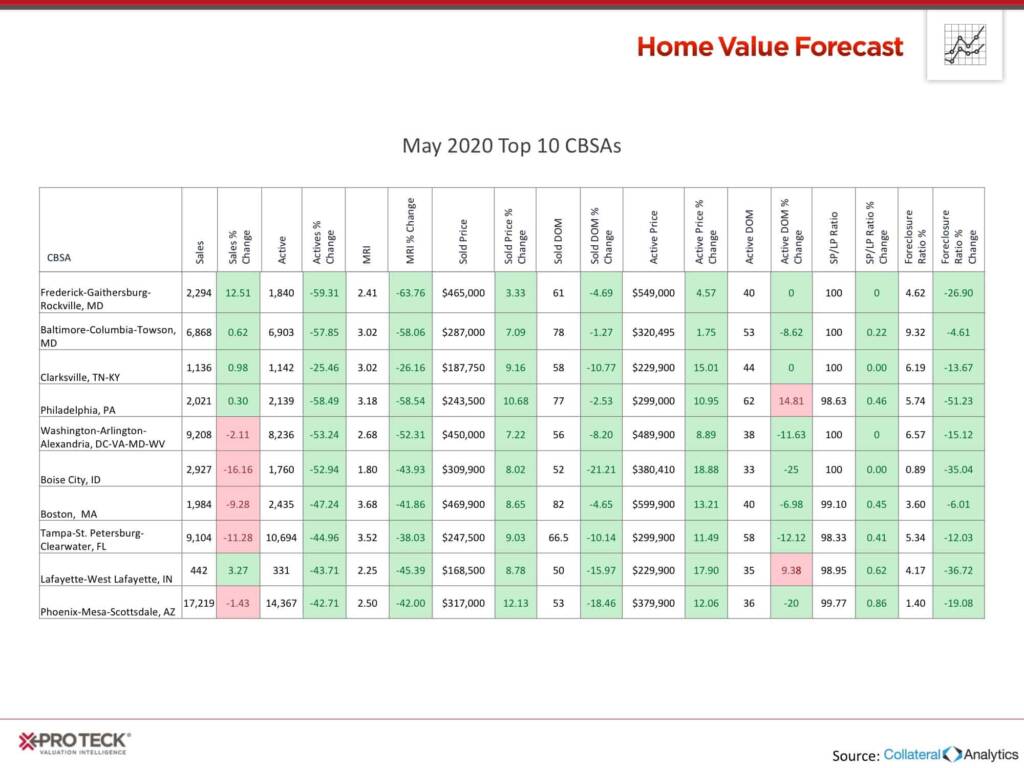
All top 10 markets share a 40 – 60% drop in active listings compared to the same time last year, which is a clear indicator of the impact COVID-19 is having on the spring buying season. Many are forecasting that the traditionally “hot” spring real estate market will occur in July and August as more regions open up and people’s fears lessen.
Most economists are predicting home values to hold with little to no appreciation this year, with Realtor.com estimating 1.1% appreciation for 2020. There is less demand for homes but also less supply, making the overall market dynamic similar to previous years, but at a slower pace.
The other lever in the real estate market is the number of foreclosures, as that was what drove housing prices down during the 2008 housing crash. There’s always been a high correlation between foreclosures and unemployment, which is making many experts and economists weary. This graph justifies that concern:
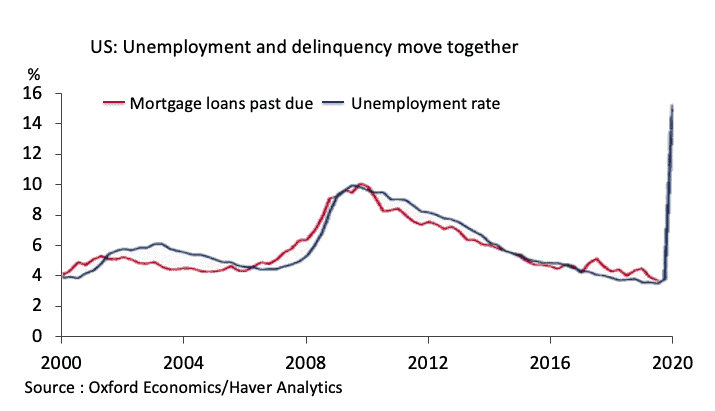
So the question becomes, are we going to have a rapidly expanding foreclosure crisis like 2008? At this moment, we don’t believe so.
Today, homeowner equity as a share of total home values sits at 64%, its highest level since 2002. More than a decade of tighter underwriting standards and higher loan-to-value requirements means more Americans have equity in their homes. With equity comes loan modification options and other foreclosure alternatives, like refinancing at lower rates or short sale.
We all hope that the unemployment numbers come down as swiftly as they rose, which should help mitigate some concern about potential future foreclosures spikes.
ABOUT SVI’S MONTHLY HOUSING MARKET REPORT
The Home Value Forecast uses a ranking system that is purely objective and is based on directional trends of nine market indicators. Each indicator is given a score based on whether the trend is positive, negative or neutral for that series. For example, a declining trend in active listings would be positive, as would an increasing trend in average price. A composite score for each CBSA is calculated by summing the directional scores of each of its indicators. From the universe of the top 200 CBSAs, each month we highlight topics and trends in the real estate market.