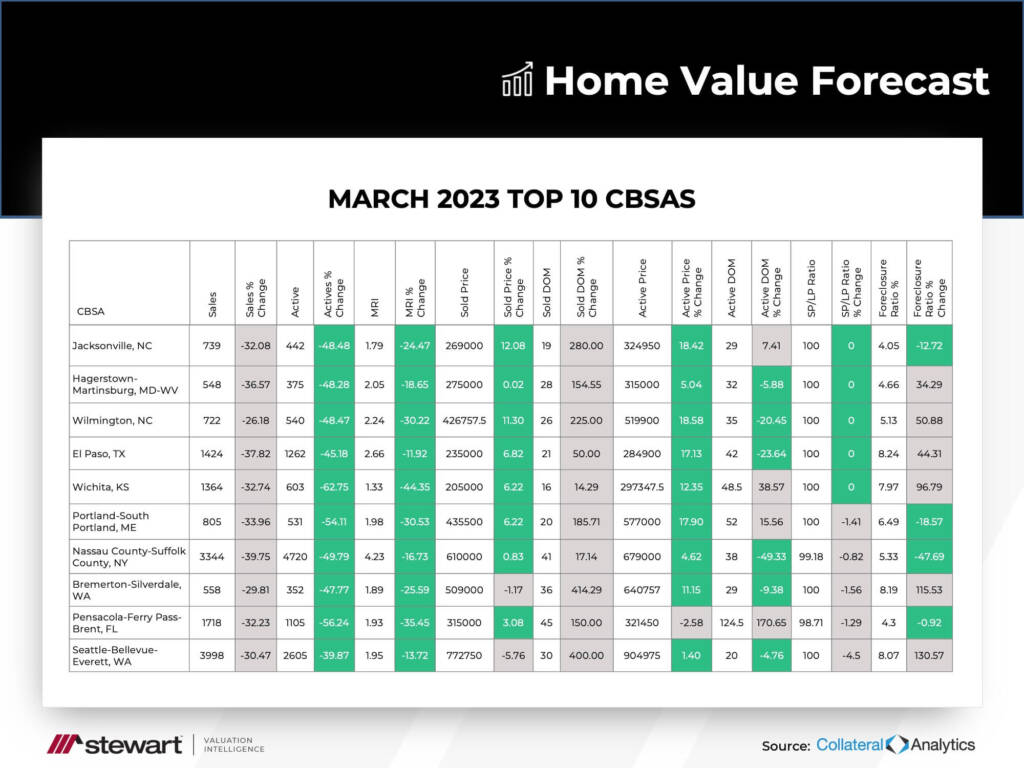
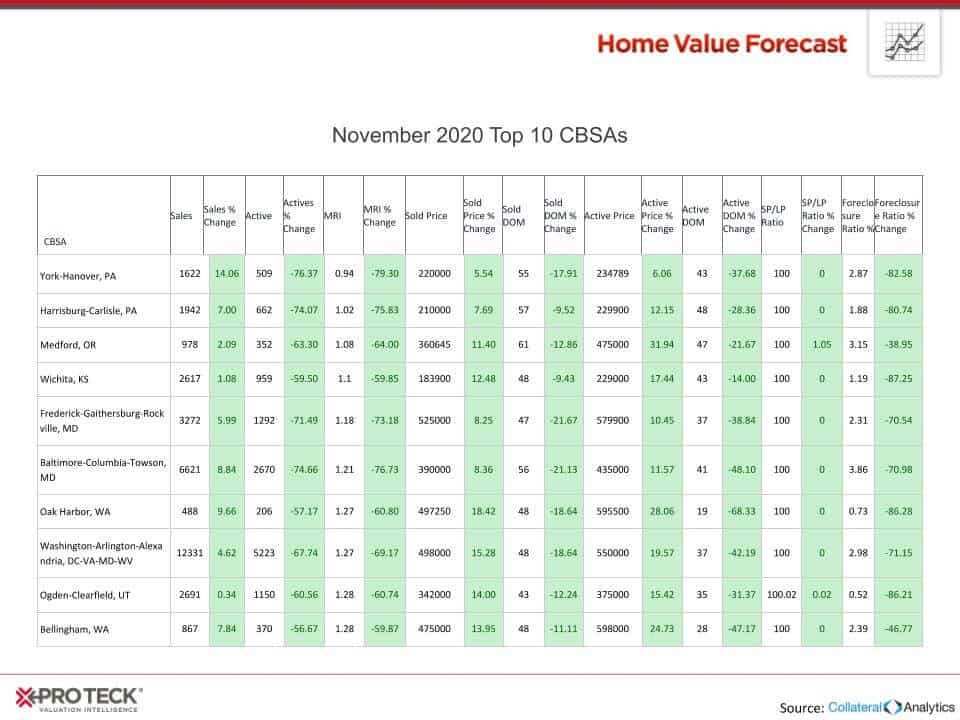
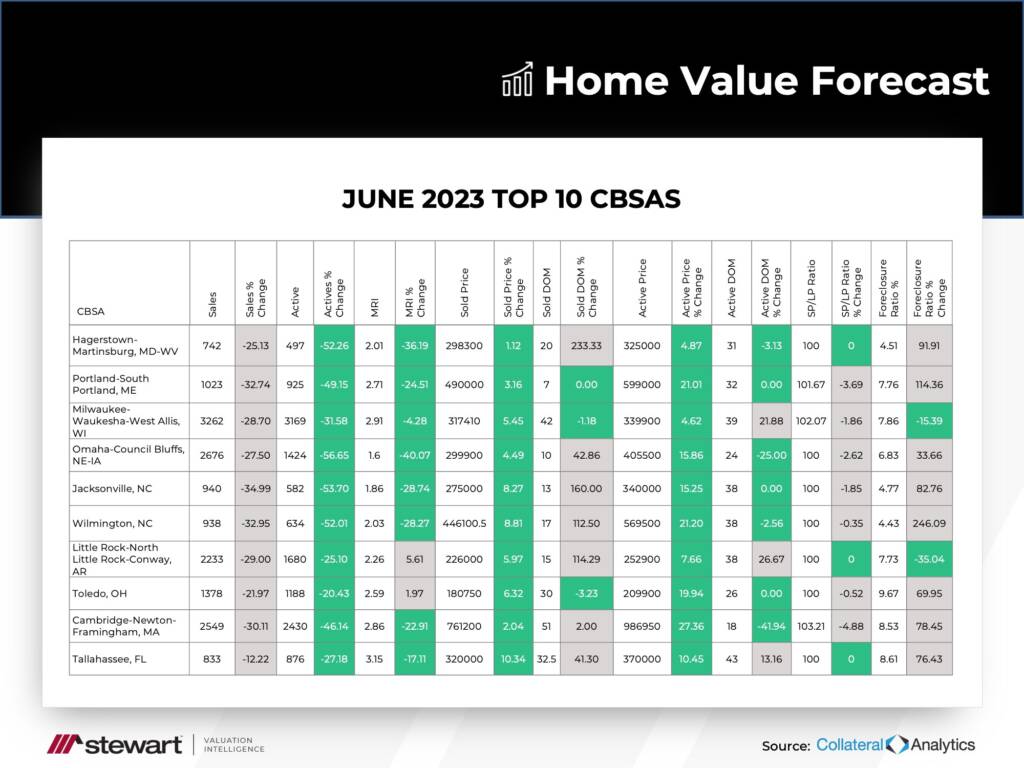
Each month, Home Value Forecast uses a number of leading real estate market-based indicators to monitor single-family home market activity in the nation’s top 200+ metropolitan areas (CBSAs) and report on the Top 10.
THE TOP 10
The Home Value Forecast Top 10 Hottest Housing Markets ranking system is purely objective and is based on directional trends over the past eight quarters. It’s not a listing of what markets are most expensive or most in need of inventory; it ranks market momentum at a specific point in time.
This month’s top 10:

This month, things stayed fairly consistent with six metros staying in the top 10 from last month. Again like last month, markets across the country are represented.
A few years ago, the top 10 was dominated by the West Coast, with California and Washington making up the majority of hot markets. In fact, exactly three years ago, six of the top 10 were from those two states. So, where are they now?
Bottom 10
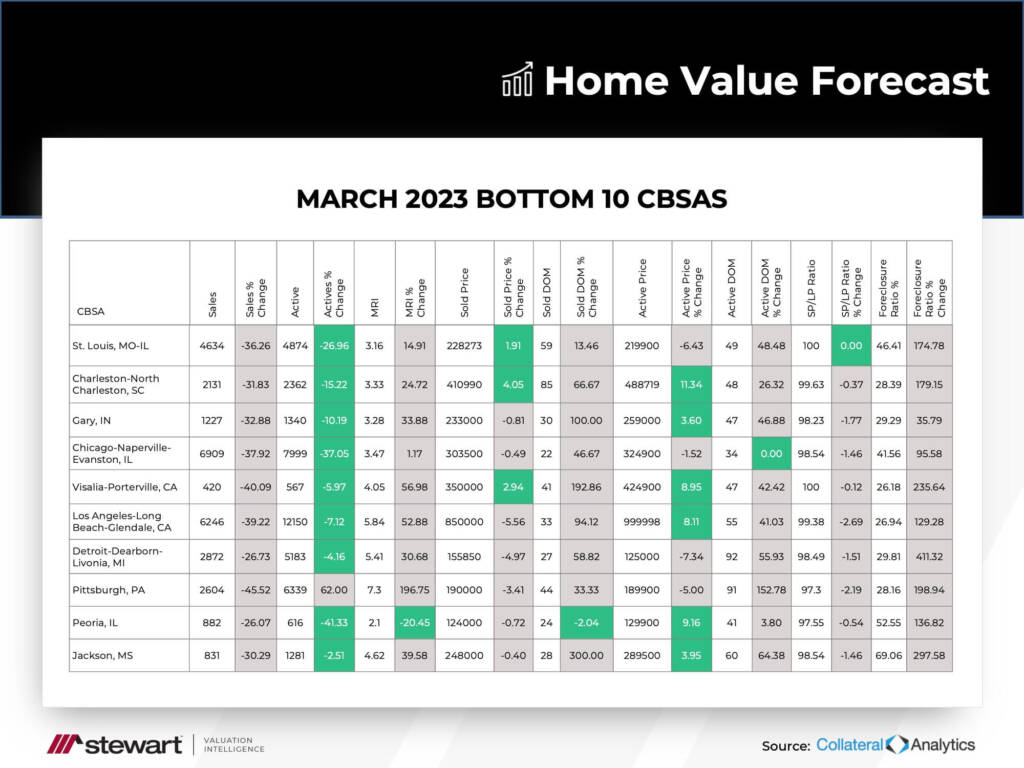
In this month’s Home Value Forecast, we are bringing back the bottom 10 markets for the first time in a number of years. Let’s take a look:

In year’s past, the bottom 10 were fairly consistent, with metros such as Detroit, Atlantic City, Gary, Ind. and Jackson, Miss. consistently being there. Today, some new entrants like Charleston, Chicago and two California metros are there. So, what’s happening?
As we say at the beginning of each Home Value Forecast, our ranking system looks at market momentum at a specific point in time. In Washington and California, momentum is slowing down.
Of the 35 core-based statistical areas (CBSA) in Washington and California, only eight were “good” or “normal,” while the majority were ranked “soft” or “weak.” This most likely will continue until interest rates decline and jobs from recent layoffs return.
| CBSA Name | Market Condition |
| Bremerton-Silverdale, WA | Good |
| Seattle-Bellevue-Everett, WA | Good |
| Mount Vernon-Anacortes, WA | Normal |
| Olympia-Tumwater, WA | Normal |
| Tacoma-Lakewood, WA | Normal |
| Bellingham, WA | Normal |
| Spokane-Spokane Valley, WA | Normal |
| Oak Harbor, WA | Normal |
| Bakersfield, CA | Soft |
| Portland-Vancouver-Hillsboro, OR-WA | Soft |
| Sacramento–Roseville–Arden-Arcade, CA | Soft |
| Modesto, CA | Soft |
| San Diego-Carlsbad, CA | Soft |
| Fresno, CA | Soft |
| Yuba City, CA | Soft |
| Santa Maria-Santa Barbara, CA | Soft |
| San Francisco-Redwood City-South San Francisco, CA | Soft |
| Stockton-Lodi, CA | Soft |
| San Rafael, CA | Soft |
| Oakland-Hayward-Berkeley, CA | Soft |
| San Luis Obispo-Paso Robles-Arroyo Grande, CA | Soft |
| Oxnard-Thousand Oaks-Ventura, CA | Soft |
| San Jose-Sunnyvale-Santa Clara, CA | Soft |
| Anaheim-Santa Ana-Irvine, CA | Soft |
| Riverside-San Bernardino-Ontario, CA | Soft |
| Madera, CA | Soft |
| Vallejo-Fairfield, CA | Soft |
| Santa Rosa, CA | Soft |
| Santa Cruz-Watsonville, CA | Soft |
| Salinas, CA | Soft |
| Chico, CA | Soft |
| Visalia-Porterville, CA | Weak |
| Merced, CA | Weak |
| Redding, CA | Weak |
| Los Angeles-Long Beach-Glendale, CA | Weak |
ABOUT STEWART VALUATION INTELLIGENCE’S MONTHLY HOUSING MARKET REPORT
The Home Value Forecast uses a ranking system that is purely objective and is based on directional trends of market indicators. Each indicator is given a score based on whether the trend is positive, negative or neutral for that series. For example, a declining trend in active listings would be positive, as would an increasing trend in average price. A composite score for each CBSA is calculated by summing the directional scores of each of its indicators.

