Home Value Forecast
Home Value Forecast Top 10, July 2021
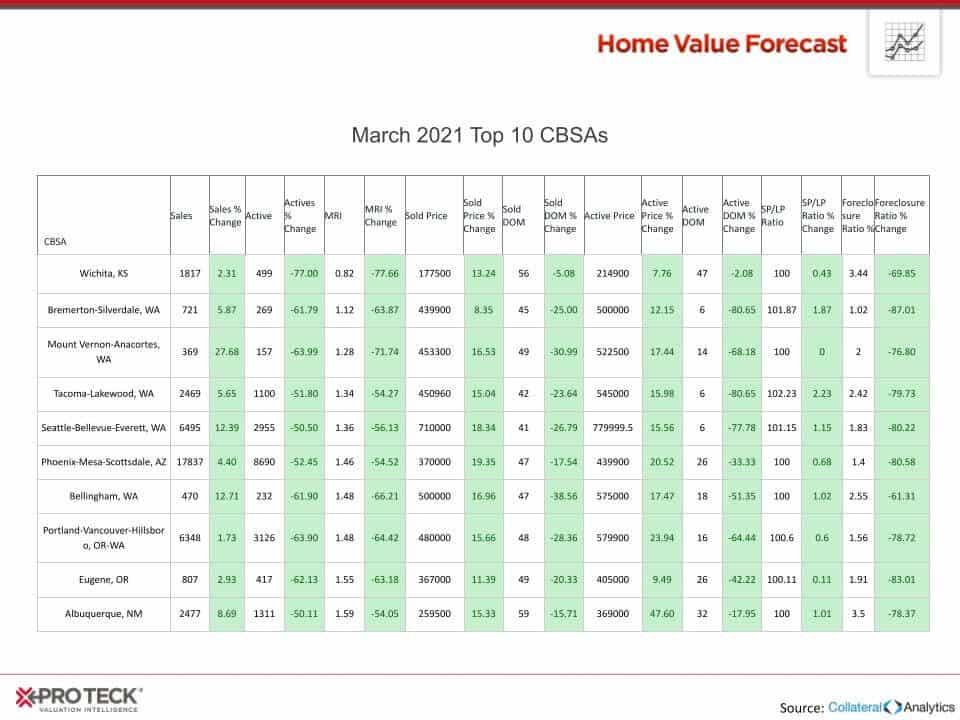
Each month, Home Value Forecast uses a number of leading real estate market-based indicators to monitor single-family home market activity in the nation’s top 200+ metropolitan areas (CBSAs) and report on the Top 10.
THE TOP 10
The Home Value Forecast Top 10 Hottest Housing Markets ranking system is purely objective and is based on directional trends over the past eight quarters. It’s not a listing of what markets are most expensive or most in need of inventory; it ranks market momentum at a specific point in time.
This month’s Top 10 has five metros from Washington state that all had Months of Remaining Inventory (MRI) under 1.33 months:
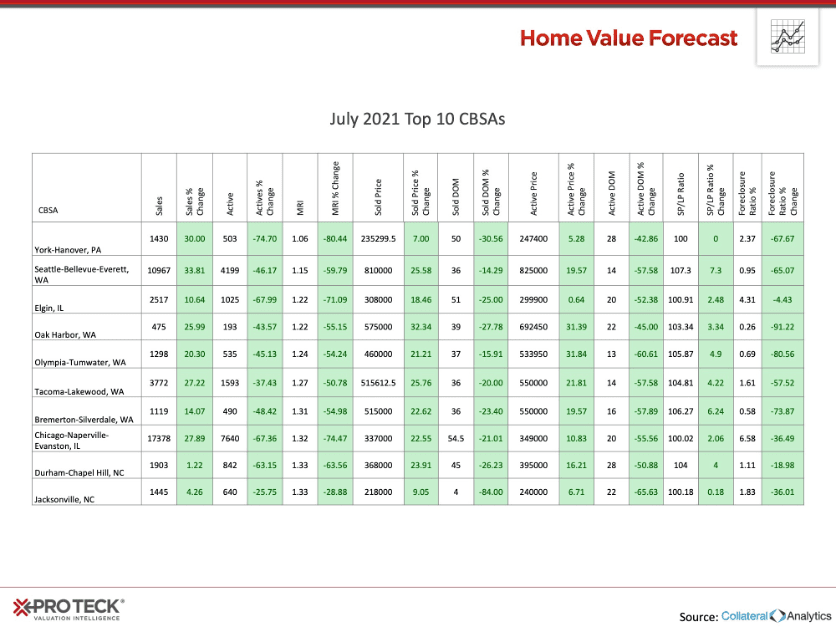
The five Washington state metros had sales price to list price ratios between 104% – 107%, making it difficult if not impossible for first time buyers to enter the market.
Last month, 218 of the 229 metros we track had a sales price to list price ratio of 100% or more. This month that has increased to 223, which equals approximately 97.4% of the metros we track, a truly historic figure.
Today, cash offers are becoming the norm and preferred option for sellers. Companies like Ribbon, Homeward and UpEquity have “all cash offer” financing options that will pay cash for a home on behalf of buyers, then pay the company back using a mortgage loan. Since the housing shortage is not ending soon, these options are becoming more attractive even with the added cost.
ABOUT SVI’S MONTHLY HOUSING MARKET REPORT
The Home Value Forecast uses a ranking system that is purely objective and is based on directional trends of market indicators. Each indicator is given a score based on whether the trend is positive, negative or neutral for that series. For example, a declining trend in active listings would be positive, as would an increasing trend in average price. A composite score for each CBSA is calculated by summing the directional scores of each of its indicators.