Home Value Forecast
Home Value Forecast Top 10, July 2022
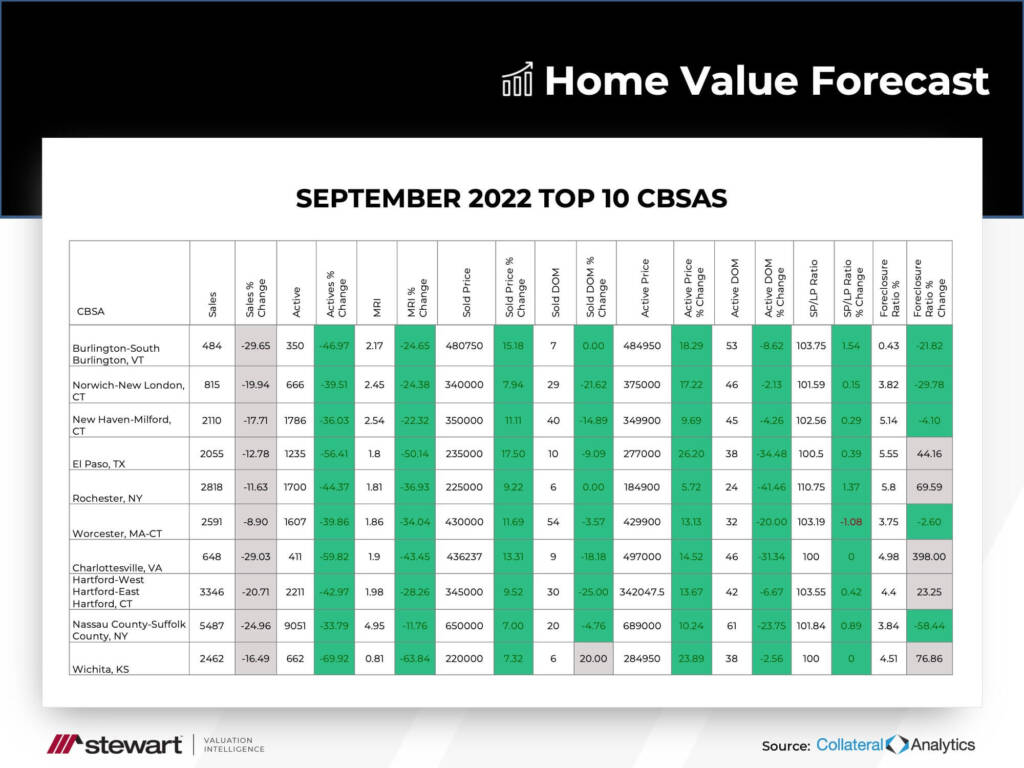
Each month, Home Value Forecast uses a number of leading real estate market-based indicators to monitor single-family home market activity in the nation’s top 200+ metropolitan areas (CBSAs) and report on the Top 10.
THE TOP 10
The Home Value Forecast Top 10 Hottest Housing Markets ranking system is purely objective and is based on directional trends over the past eight quarters. It’s not a listing of what markets are most expensive or most in need of inventory; it ranks market momentum at a specific point in time.
This month’s Top 10:

Amarillo, TX
The Amarillo, TX CBSA was at the top of our list this month, with all positive market factors and only two months of inventory. Home prices in Amarillo have been on a steady upswing, with no dip evident during the 2008 financial crisis.

Although the MRI (Months of Remaining Inventory) number of 2.01 is very low, it is also deceiving.
With the average home going for $207,000, you can see from the chart below that homes up to $299,000 have an MRI of 1, meaning there’s just not enough inventory. Things start to open up in the more expensive homes (seven months of inventory in homes between $650k– $699k, for example), leading to the average number of 2.

Good news if you’re looking for a seven-bedroom home: With an MRI of 24, you might be able to negotiate a better deal and pay below listing in Amarillo!

ABOUT PRO TECK’S MONTHLY HOUSING MARKET REPORT
The Home Value Forecast uses a ranking system that is purely objective and is based on directional trends of market indicators. Each indicator is given a score based on whether the trend is positive, negative or neutral for that series. For example, a declining trend in active listings would be positive, as would an increasing trend in average price. A composite score for each CBSA is calculated by summing the directional scores of each of its indicators.