Home Value Forecast
Home Value Forecast Top 10, January 2023
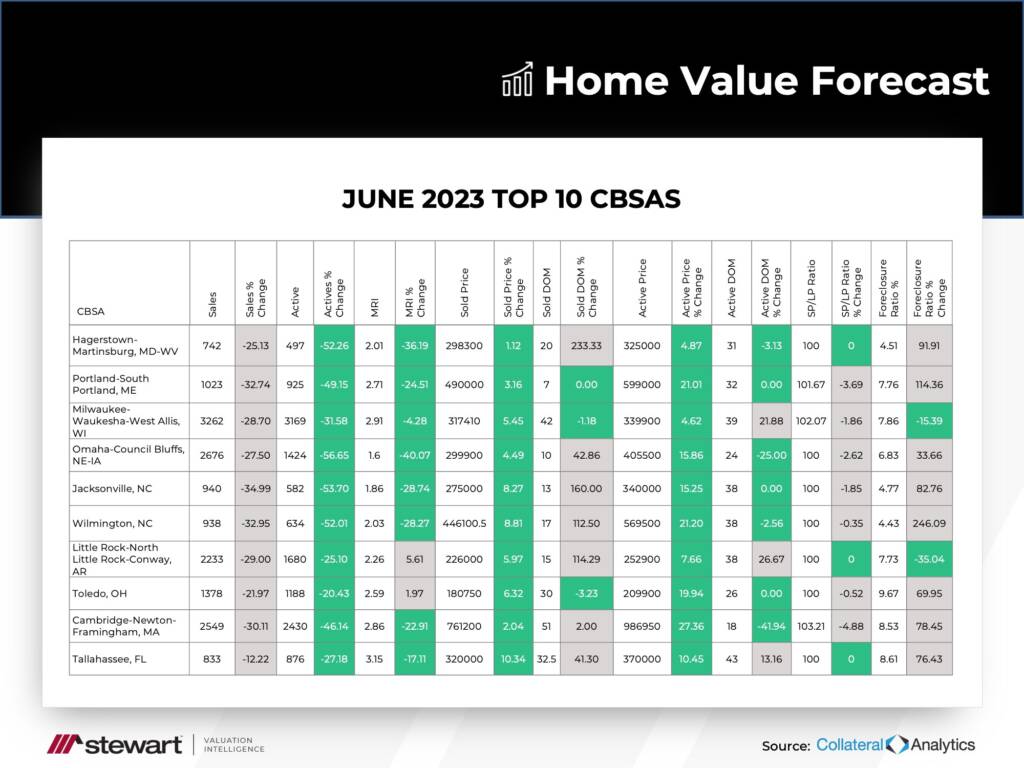
Each month, Home Value Forecast uses a number of leading real estate market-based indicators to monitor single-family home market activity in the nation’s top 200+ metropolitan areas (CBSAs) and report on the Top 10.
THE TOP 10
The Home Value Forecast Top 10 Hottest Housing Markets ranking system is purely objective and is based on directional trends over the past eight quarters. It’s not a listing of what markets are most expensive or most in need of inventory; it ranks market momentum at a specific point in time.
This month’s Top 10:
January’s Top 10 is a strange geographic mix, with a predominance of mid-market metros throughout the United States. California has cooled down and is not represented, and only one metro from Washington state made the Top 10 — both states previously making up the majority of Top 10s in 2021 and early 2022.
So what’s really going on — is the real estate market hot or not? The answer is a little bit of both. Inventory is still low but mortgage rates are definitely cooling things down.
The Hotness Ranked
HVF’s rating system also categorizes metros into seven descriptive buckets, and labels each metro’s overall housing market as either Hot, Strong, Good, Normal, Soft, Weak or Distressed. Let’s compare January 2022 to 2023:
| Market Ranking | January 2022 | January 2023 |
| Hot | 27 | 1 |
| Strong | 131 | 9 |
| Good | 48 | 43 |
| Normal | 6 | 80 |
| Soft | 14 | 87 |
| Weak | 2 | 8 |
| Distressed | 1 | 1 |
Markets have gone from being very top-heavy in 2022 with 158 metros either being “Hot” or “Strong” to only 10 today.
Today, the market is more balanced, with 210 metros being in the middle “Good,” “Normal,” or “Soft” range. Where it goes from here will be based on how “mild” the recession is and how successful the Federal Reserve is in sticking with the desired “soft landing” for the economy.
ABOUT STEWART VALUATION INTELLIGENCE’S MONTHLY HOUSING MARKET REPORT
The Home Value Forecast uses a ranking system that is purely objective and is based on directional trends of market indicators. Each indicator is given a score based on whether the trend is positive, negative or neutral for that series. For example, a declining trend in active listings would be positive, as would an increasing trend in average price. A composite score for each CBSA is calculated by summing the directional scores of each of its indicators.