Home Value Forecast
Minnesota Hotdish: Top 5 State Ranking Heats Up Housing Markets
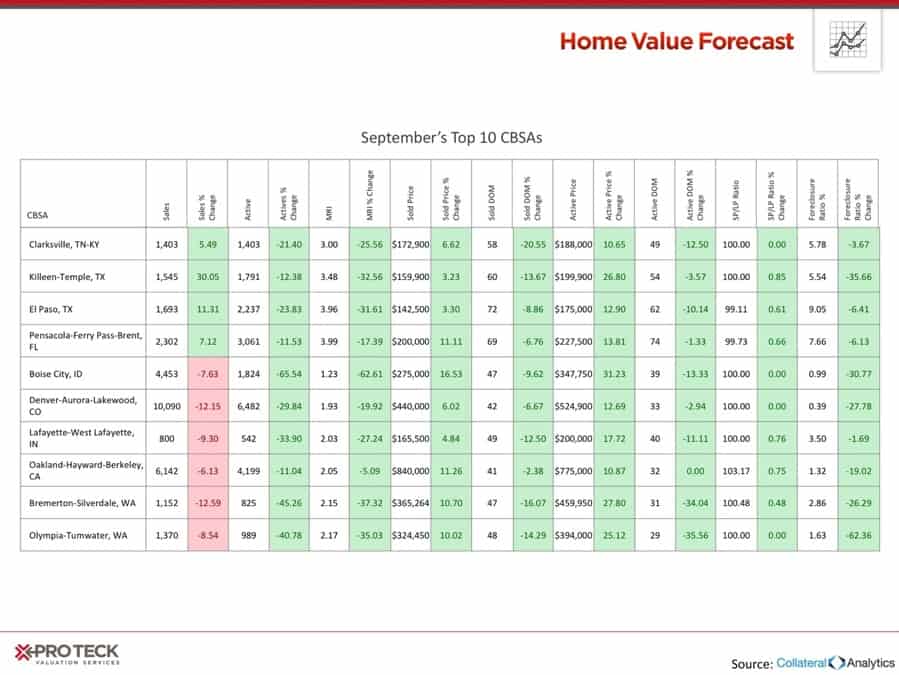
Each month, HVF’s Housing Market Report uses a number of leading real estate market-based indicators to report on activity in the single-family home markets in the top 200 metropolitan areas (CBSAs) in the U.S., and reports on the Top Ten.
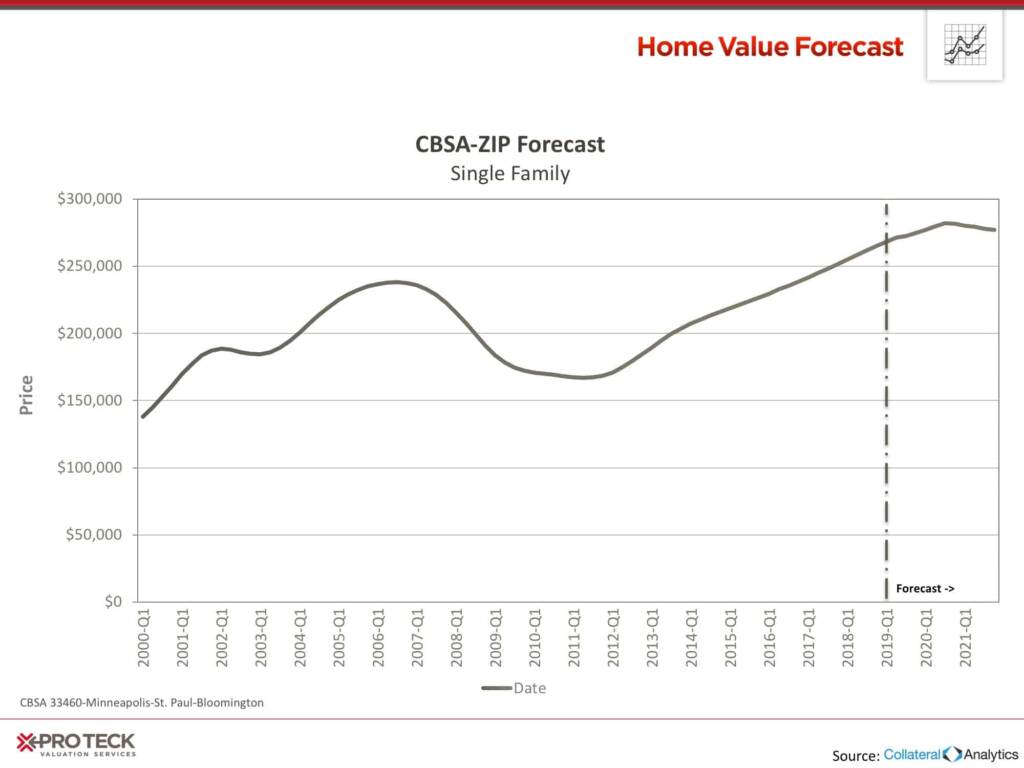
In this month’s Housing Market Report, we take we look at the Minneapolis/St. Paul/Bloomington, WI metro one of the hottest markets on our Top 10 list. As a new face on our Top 10, we like to take a closer look at what might be impacting such growth.
Minnesota was recently ranked the #3 and #5 best state to live in, according to CNBC and 24/7 Wall Street, respectively. The rankings factor in statistics regarding poverty rates, life expectancy, population growth, unemployment rates, education, crime rates and quality of life. Minnesota has the highest high school graduation rate (93.1%), largest percentage of the population with post-secondary education (74.4%), low unemployment rate (2.8%) and a steadily growing population (7.3%). Minnesota has also added nearly 37,000 jobs over the last year.
These factors are clearly impacting the housing markets in the Twin Cities, as the markets have seen healthy growth over the last two years. In fact, the Minneapolis/St. Paul CBSA median home price is up more than 16% from pre-recession levels.
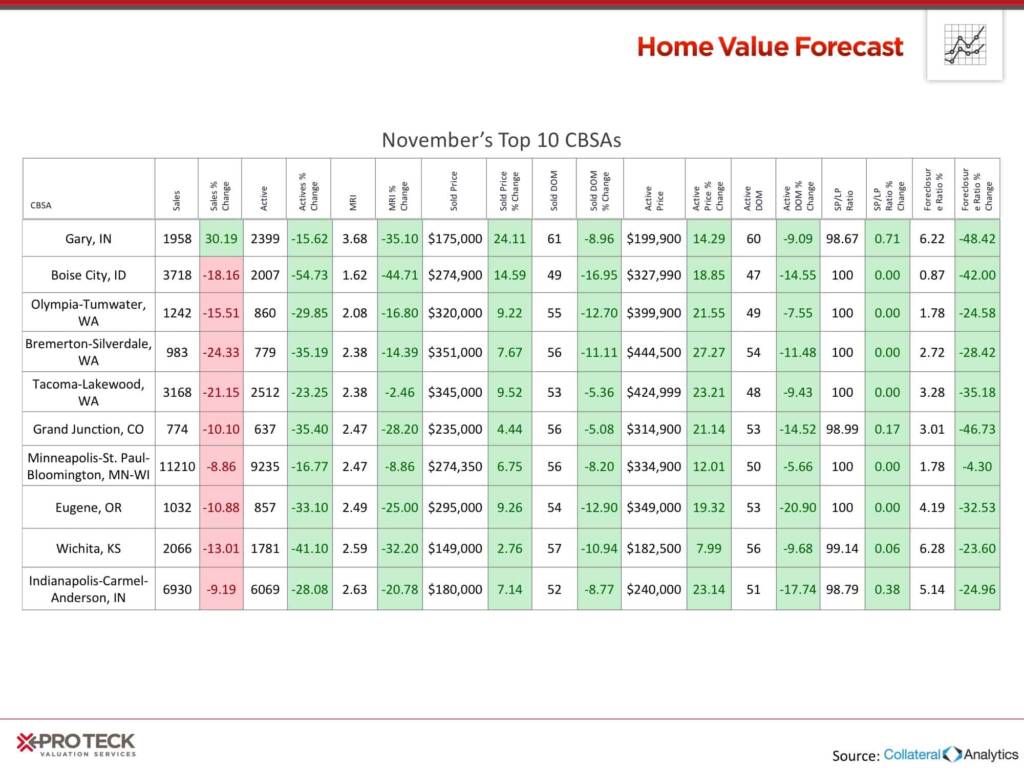
Because there is no shortage of people looking to move to such a favorable location, the Minneapolis/St. Paul/Bloomington metro is still very much a seller’s market. Month’s Remaining Inventory is just 2.47, and the Active Days on Market for this metro is one of the lowest of our Top 10, at just 50 days. The trend is poised to continue, as the number of active listings was down this month by 16%.
Top Ten:
Interested in learning more about the top metros featured in this month’s market report? Contact SVI for more in-depth information on each CBSA listed in this month’s report.
ABOUT STEWART VALUATION INTELLIGENCE’S MONTHLY HOUSING MARKET REPORT
The Home Value Forecast uses a ranking system that is purely objective and is based on directional trends of market indicators. Each indicator is given a score based on whether the trend is positive, negative or neutral for that series. For example, a declining trend in active listings would be positive, as would an increasing trend in average price. A composite score for each CBSA is calculated by summing the directional scores of each of its indicators.