Home Value Forecast
Home Value Forecast: 2023 End-of-Year Review of the Residential Real Estate Market
Happy holidays!
It’s time for the final Home Value Forecast (HVF) of 2023. Join us as we examine real estate trends over the past 12 months and detail the top three core-based statistical areas (CBSAs) in the following categories:
- Highest current sales price
- Current months of remaining inventory
- 12-month sales price appreciation
This is now the 10th time we have conducted this year-end analysis that we previously published as Pro Teck. Let’s jump into the numbers.
CURRENT SALES PRICE
In 2023, the three California metro areas of San Jose, San Rafael and San Francisco lead the list of CBSAs with the highest current sales price. These three metros have been leading this category since we started this review in 2014. Below, we show the appreciation of each over the last seven years.
Top Current Sales Price CBSA’s
| CBSA Name | Sold Price 2017 | Sold Price 2018 | Sold Price 2019 | Sold Price 2020 | Sold Price 2021 | Sold Price 2022 | Sold Price 2023 |
| San Francisco-Redwood City-South San Francisco, CA | $1,400,000 | $1,535,000 | $1,543,500 | $1,680,000 | $1,850,000 | $1,605,000 | $1,700,000 |
| San Rafael, CA | $1,189,782 | $1,354,500 | $1,350,000 | $1,544,500 | $1,610,000 | $1,625,000 | $1,705,008 |
| San Jose-Sunnyvale-Santa Clara, CA | $1,150,000 | $1,250,000 | $1,199,055 | $1,373,750 | $1,570,000 | $1,530,000 | $1,710,000 |
In 2017, the average home price in San Jose was $1.15 million; homes have appreciated 48.7% since then.
According to the Federal Reserve Bank of St. Louis, the median home sales price in the U.S. is $431,000.79 of the 228 metros we track at HVF, 35% of CBSAs in the U.S. have averages above the U.S. median with nine metros averaging home costs more than $1 million. (This information is as of December 2023.)
MONTHS OF REMAINING INVENTORY
Months of remaining inventory (MRI) is another indicator of how hot a market is at a particular time. MRI equals the number of households on the market divided by the number that sell per month. If an area has a high MRI (for example — seven months or more), it means that the market is saturated, which is also known as a buyer’s market. If the MRI is low (fewer than three months), it becomes a seller’s market. A balanced market will have approximately six months of inventory at any given time.
The top three markets in terms of MRI for December 2023 are:
| CBSA Name | MRI |
| Seattle-Bellevue-Everett, WA | 1.46 |
| Frederick-Gaithersburg-Rockville, MD | 1.55 |
| Rochester, NY | 1.59 |
In total, there are 88 CBSAs with MRIs under three months; surprisingly, it’s the exact same number we had in December 2022.
As of December 2023, 208 of the 228 CBSAs we track have MRI below the six-month “balanced” market threshold. With a lack of housing supply and rates expected to come down in 2024, we see a tight housing market for the foreseeable future.
12-MONTH SALES PRICE APPRECIATION
In our report, sales price appreciation is calculated as the rolling three-month average sale price compared to the same three-month time period from the previous year.
Our December 2023 top three:
| CBSA Name | Sold Price Percentange Change |
| Champaign-Urbana, IL | 18.30 |
| Syracuse, NY | 16.34 |
| Canton-Massillon, OH | 16.22 |
As you can see, major markets are not at the top of appreciation in 2023. With higher rates and tightening inventory, the largest gains were in secondary markets.
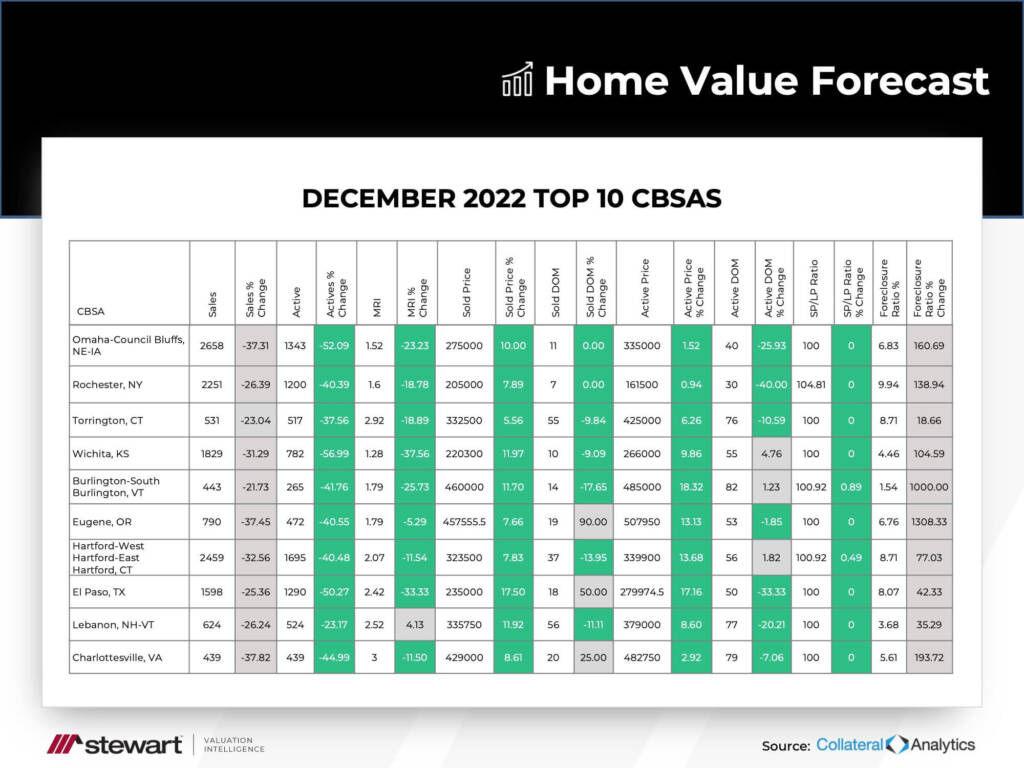
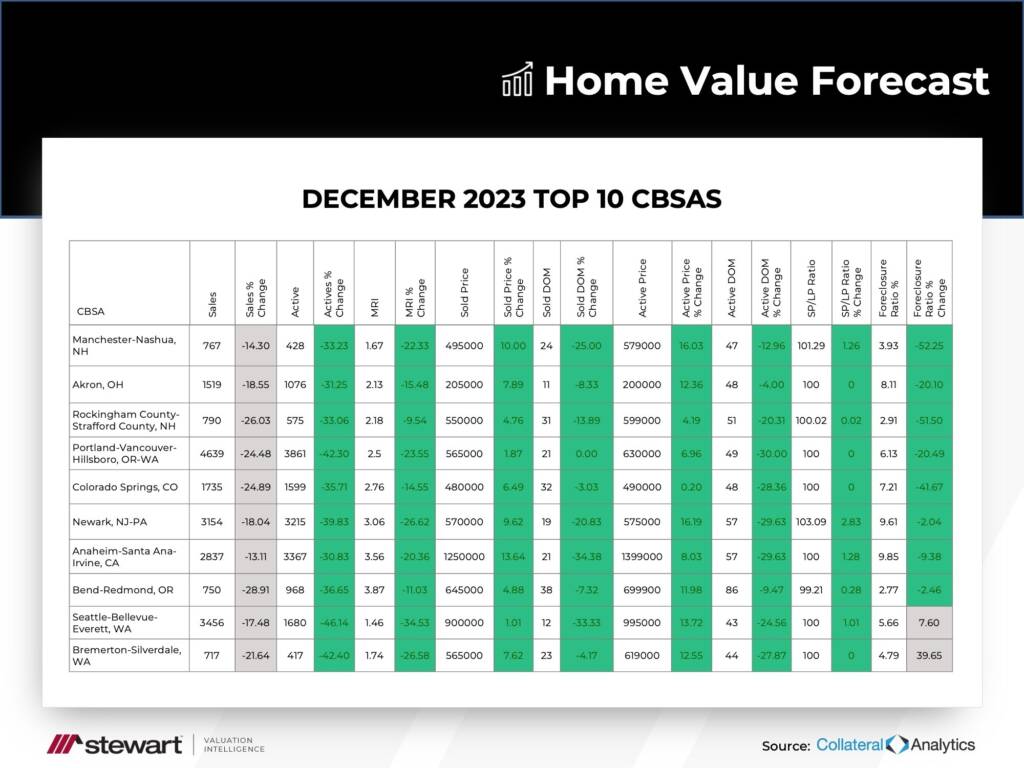
THE LAST TOP 10 OF 2023
Thank you for your continued interest, and from all of us at Stewart Valuation Intelligence, we hope you and your family have a happy and healthy 2024!
ABOUT SVI’S MONTHLY HOUSING MARKET REPORT
Each month, Home Value Forecast uses a number of leading real estate market-based indicators to report on activity in the single-family home markets in the top 200+ metropolitan areas (CBSAs) in the U.S. and reports on the top 10.
The Home Value Forecast uses a ranking system that is purely objective and is based on directional trends of nine market indicators. Each indicator is given a score based on whether the trend is positive, negative or neutral for that series. For example, a declining trend in active listings would be positive, as would an increasing trend in average price. A composite score for each CBSA is calculated by summing the directional scores of each of its indicators. From the analysis of the top 200+ CBSAs each month we highlight topics and trends in real estate.
It’s not a listing of what markets are most expensive or most in need of inventory — it ranks market momentum at a specific point in time.