Home Value Forecast
Home Value Forecast: 2019 End-of-Year Review of the Residential Real Estate Market
Happy Holidays from Stewart Valuation Intelligence!
For the final Home Value Forecast of the year, we will examine trends over the past 12 months and list the Top 3 CBSAs in the following categories:
- Highest Current Sales Price
- Current Months of Remaining Inventory
- 12 Month Sales Price Appreciation
CURRENT SALE PRICE
For 2019, the three California metros of San Francisco, San Rafael and San Jose earned a place atop the list of CBSAs with the Highest Current Sales Price. These three metros have been leading this category since we started this review in 2014.
The numbers:
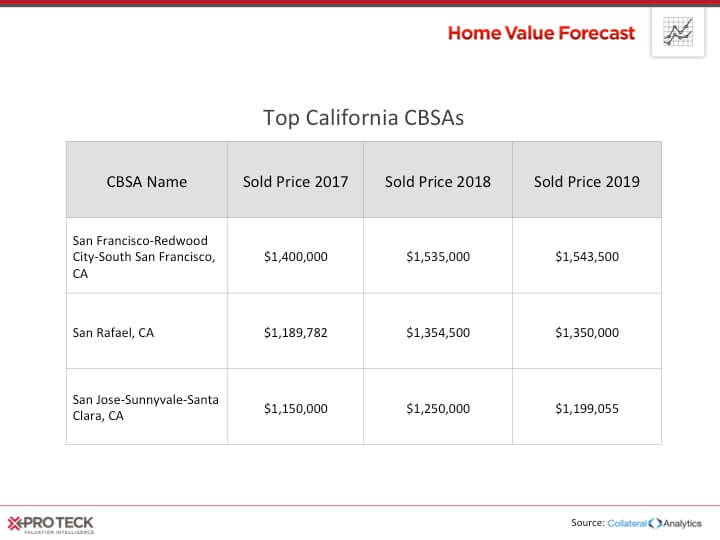
What has changed is the appreciation, or lack thereof. While San Francisco and San Rafael have had modest appreciation this year, San Jose’s average sold price has fallen by $50,000. This cooling off has kept these high-priced markets off of our Top 10 list for some time.
In all, California CBSAs accounted for 13 of the top 15 spots in this category — with Vineyard Haven, MA (#4) and Honolulu, HI (#7) being the others.
MONTHS OF REMAINING INVENTORY (MRI)
MRI is another indicator of how “hot” a market is at a particular time. MRI equals the number of households on the market divided by the number that sell per month. If an area has a high MRI (let’s say 10 months), it means that the market is saturated — a buyer’s market. If MRI is low (below 3 months) then it becomes a seller’s market. A “balanced” market will have approximately 6 months of inventory at any given time.
The top three markets in terms of MRI for 2019 are:
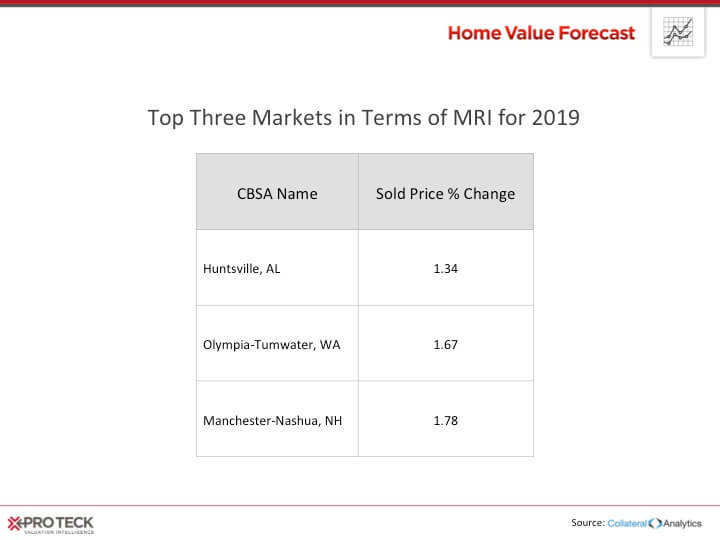
In total, there are 49 CBSAs with MRIs under three months – up from 32 last year. The 49 CBSAs are from across the country and are made up of both large and small metros. National trends of high employment, low interest rates and more millennials entering the housing market have contributed to this trend.
12-MONTH SALES PRICE APPRECIATION
In our report, sales price appreciation is calculated as the rolling three-month average sale price compared to the same three-month time period from the previous year. Our top three all had more than 13% appreciation from the same time last year:
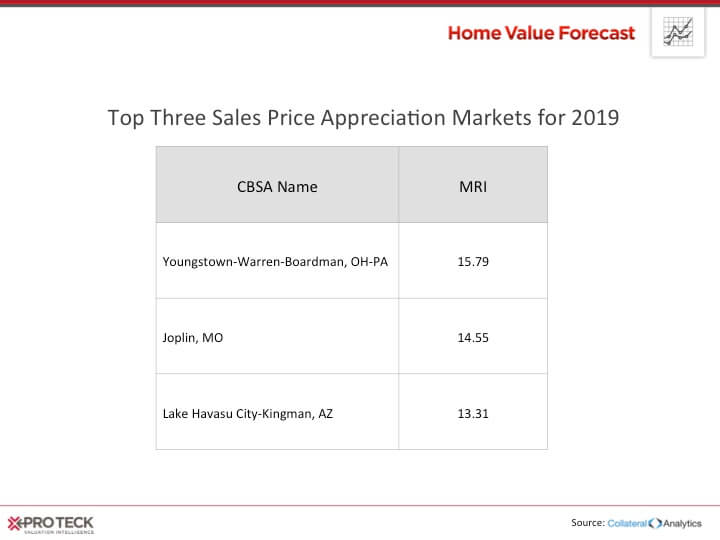
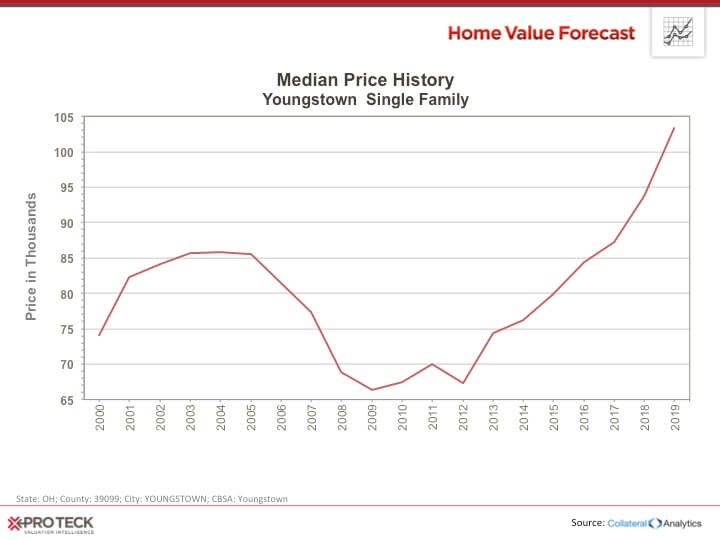
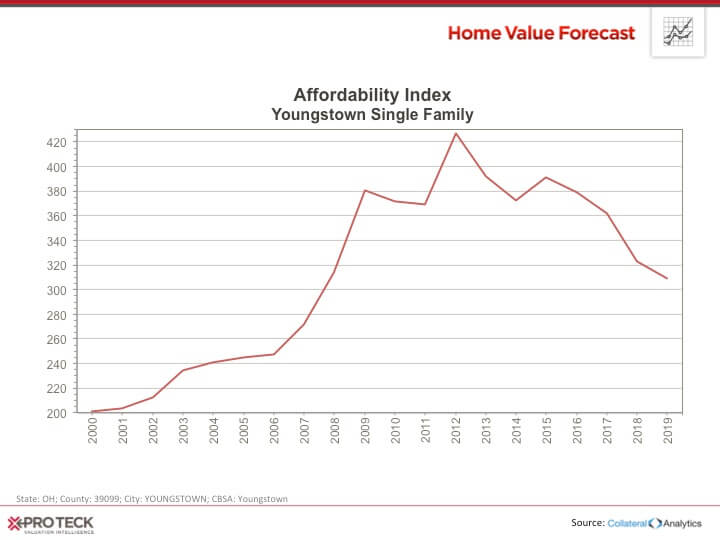
The Youngtown-Warren-Boardman, OH-PA CBSA has been on an upward trajectory since 2012:With prices still very affordable and an affordability index more than three times the national average of 100, I would expect appreciation to continue if the current economic climate persists.
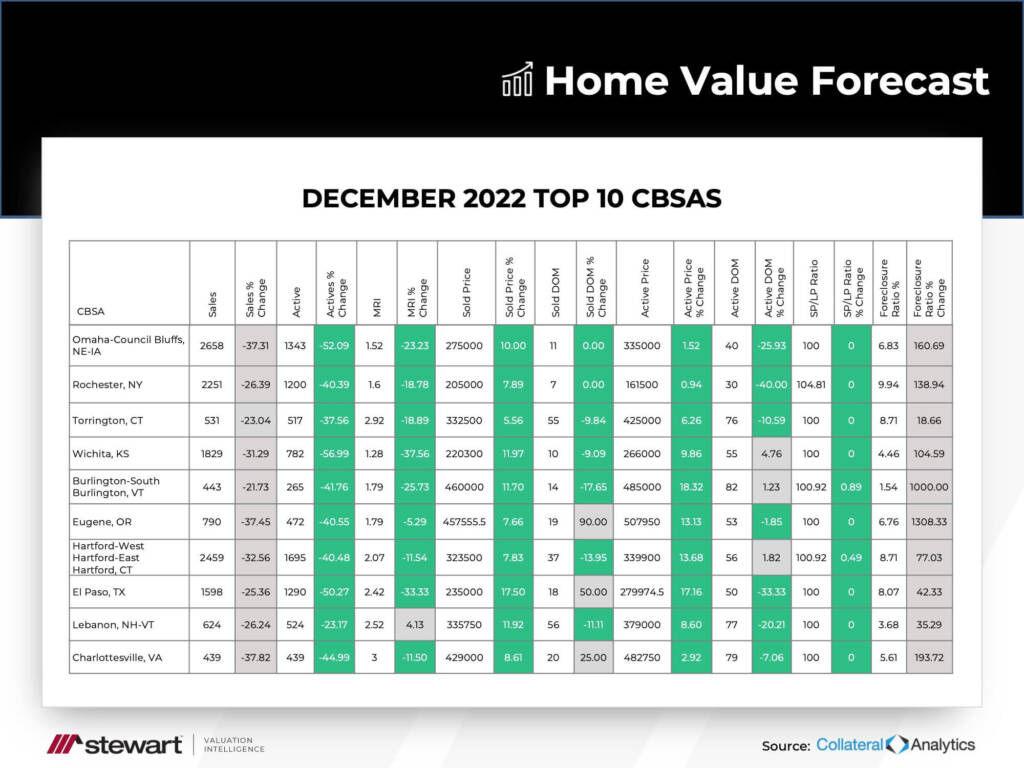
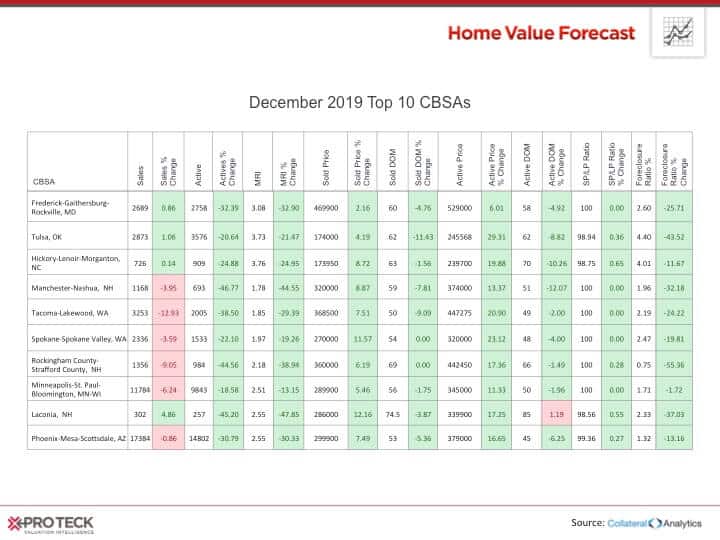
That wraps up our end-of-year report. But before we go, this month’s Top 10.
Each month, Home Value Forecast uses a number of leading real estate market-based indicators to report on activity in the single-family home markets in the top 200+ metropolitan areas (CBSAs) in the U.S., and reports on the Top 10.
The Home Value Forecast Top 10 ranking system is purely objective and is based on directional trends. It’s not a listing of what markets are most expensive or most in need of inventory — it ranks market momentum at a specific point in time.
THE LAST TOP 10 OF 2019
From all of us at SVI, have a happy and prosperous 2020!
ABOUT SVI’S MONTHLY HOUSING MARKET REPORT
The Home Value Forecast uses a ranking system that is purely objective and is based on directional trends of nine market indicators. Each indicator is given a score based on whether the trend is positive, negative or neutral for that series. For example, a declining trend in active listings would be positive, as would an increasing trend in average price. A composite score for each CBSA is calculated by summing the directional scores of each of its indicators. From the universe of the top 200 CBSAs, each month we highlight topics and trends in the real estate market.