Home Value Forecast
Home Value Forecast: 2018 End-of-Year Review of the Residential Real Estate Market
Happy Holidays from all of us at SVI!
As is tradition, for the year’s final Home Value Forecast we will examine trends over the past 12 months and list the Top 3 CBSAs in the following categories:
- Highest Current Sales Price
- Current Months of Remaining Inventory
- 12 Month Sales Price Appreciation
AND THE AWARD GOES TO … CALIFORNIA CBSAs AGAIN DOMINATE CURRENT SALE PRICE CATEGORY
In 2018, the three California metros of San Francisco, San Rafael and San Jose earned a place atop the list of CBSAs with the Highest Current Sales Price. Averaging a current sales price of $1.38 million, these three California metros are some of the hottest and most expensive in the United States.
The same three were also on the list in 2017 and, based on market forecasts, are poised to continue their streak into 2019. In fact, these same three CBSAs have been leading the way since we started this review in 2014.
Here are 2018 numbers:
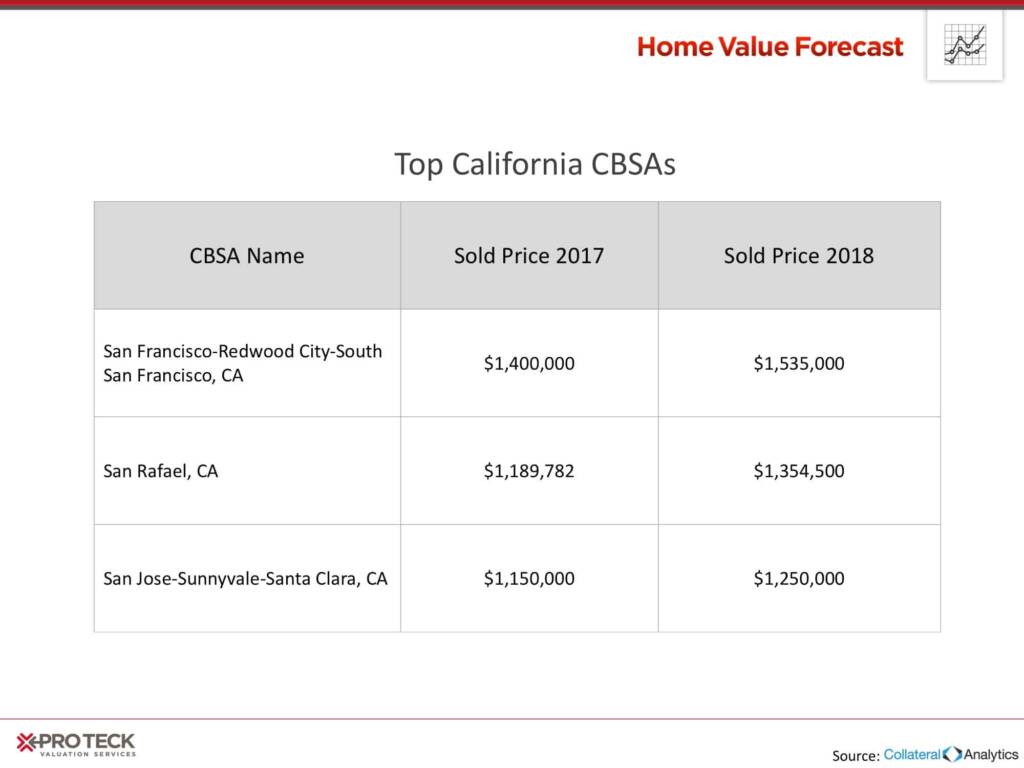
Even more impressive, California CBSAs accounted for 12 of the top 15 spots in this category — with Honolulu, HI (#7), Vineyard Haven, MA (#8), and Boulder, CO (#15) rounding out the rest of the list.
TIME FOR WESTWARD EXPANSION 2.0? MONTHS OF REMAINING INVENTORY (MRI) LOWEST IN 3 WESTERN STATES
MRI is another indicator that shows how “hot” a market is at a particular time. MRI equals the number of households on the market divided by the number that sell per month. If an area has a high MRI (let’s say 10 months), it means that the market is saturated — a buyer’s market. If MRI is low (below 3 months) then it becomes a seller’s market. A “balanced” market will have approximately 6 months of inventory at any given time.
The top three markets of 2018 are:
In total, there are 32 CBSAs with MRIs under three months – down from 49 last year. There’s been speculation in the industry about an upcoming slowdown in the real estate market – this is another sign that it’s actually happening.
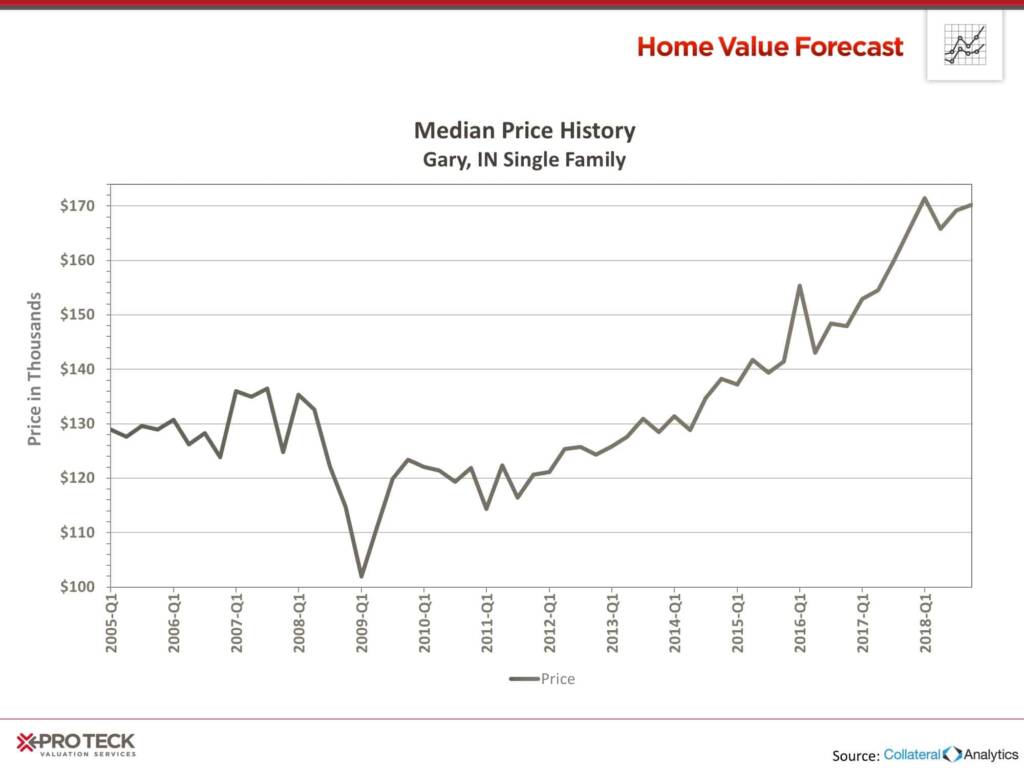
WE’RE GOING UP! 12-MONTH SALES PRICE APPRECIATION METROS ARE AREAS ON THE RISE
In our report, sales price appreciation is calculated as the rolling three-month average sale price compared to the same three-month time period from the previous year. Our top three all had more than 15% appreciation from the same time last year:
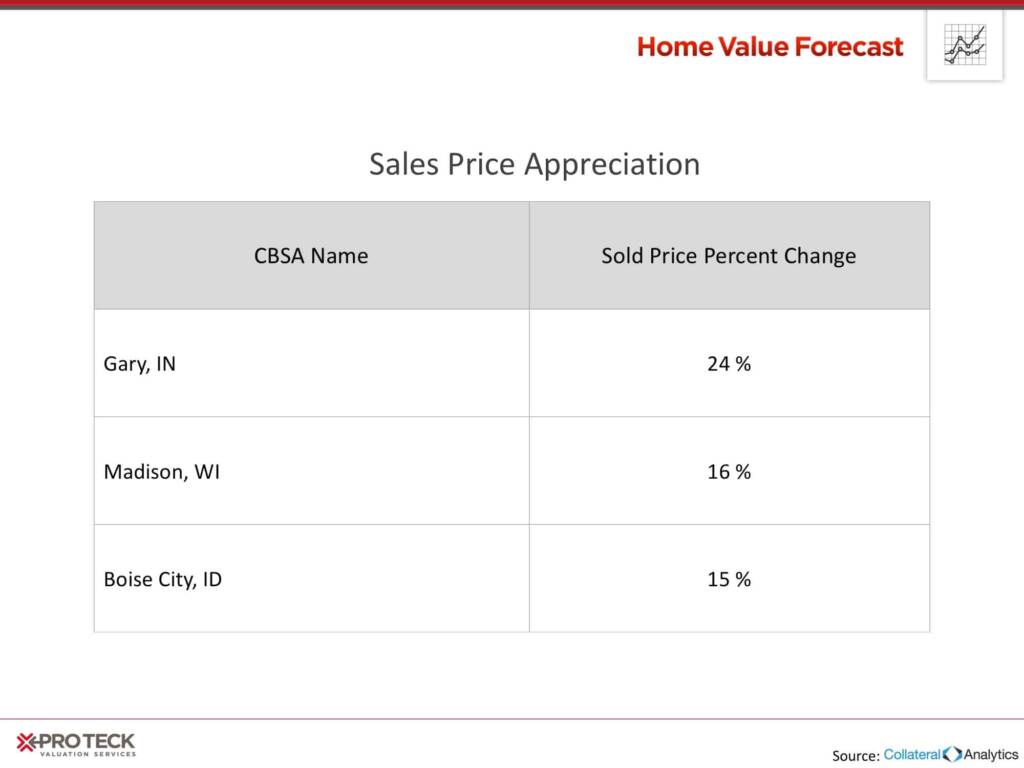
Boise, ID, is a perennial powerhouse in the real estate market, appearing in our Top 10 for almost the entire year. A fresher face to our list, the Gary, IN, CBSA, and Indiana CBSAs in general, have rebounded over the last three years, and hit new highs within the last year.
That wraps up our end-of-year report for the year in real estate. From all of us at SVI, have a happy and prosperous 2019!
About Home Value Forecast
Home Value Forecast (HVF) is brought to you by Stewart Valuation Services. HVF provides insight into the current and future state of the U.S. housing market, and delivers 14 market snapshot graphs from the top 30 CBSAs.
HVF is built using numerous housing and economic data sources. The top 750 CBSAs as well as data down to the ZIP code level for approximately 18,000 ZIPs are available with a corporate subscription to the service.
Also, Stewart Valuation Services offers reporters the following:
- National, regional or metro level housing data
- Monthly updates and HVF insight articles
- By-request data for your story — custom data, heat maps and charts are available
- Expert commentary from Home Value Forecast Editorial Committee:
- Tom O’Grady, Chief Executive Officer, Pro Teck Valuation Services
- Michael Sklarz, Ph.D., President, Collateral Analytics
- Thomas Hoff, VP, Marketing & Communications, Pro Teck Valuation Services
- Jeff Dickstein, Chief Compliance Officer, Pro Teck Valuation Services