Home Value Forecast
Home Value Forecast Top 10, October 2022: Go Gary! Indiana Metro Makes Positive Strides
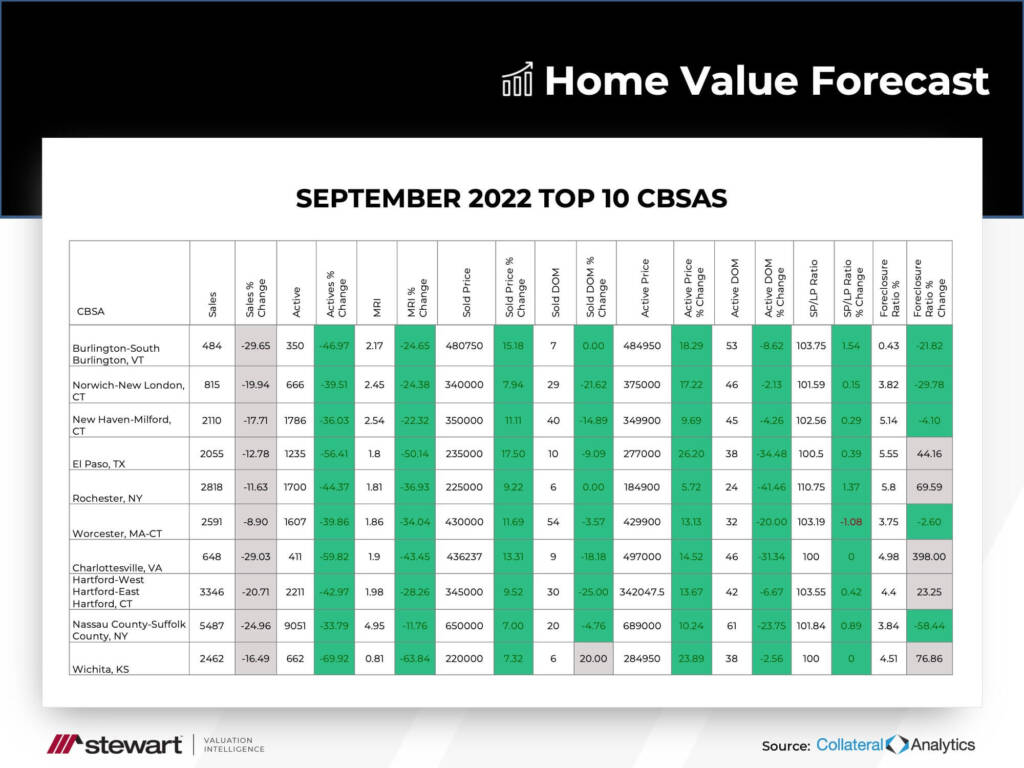
Each month, Home Value Forecast uses a number of leading real estate market-based indicators to monitor single-family home market activity in the nation’s top 200+ metropolitan areas (CBSAs) and report on the Top 10.
The TOP 10
The Home Value Forecast Top 10 Hottest Housing Markets ranking system is purely objective and is based on directional trends over the past eight quarters. It’s not a listing of what markets are most expensive or most in need of inventory; it ranks market momentum at a specific point in time.
This month’s Top 10:
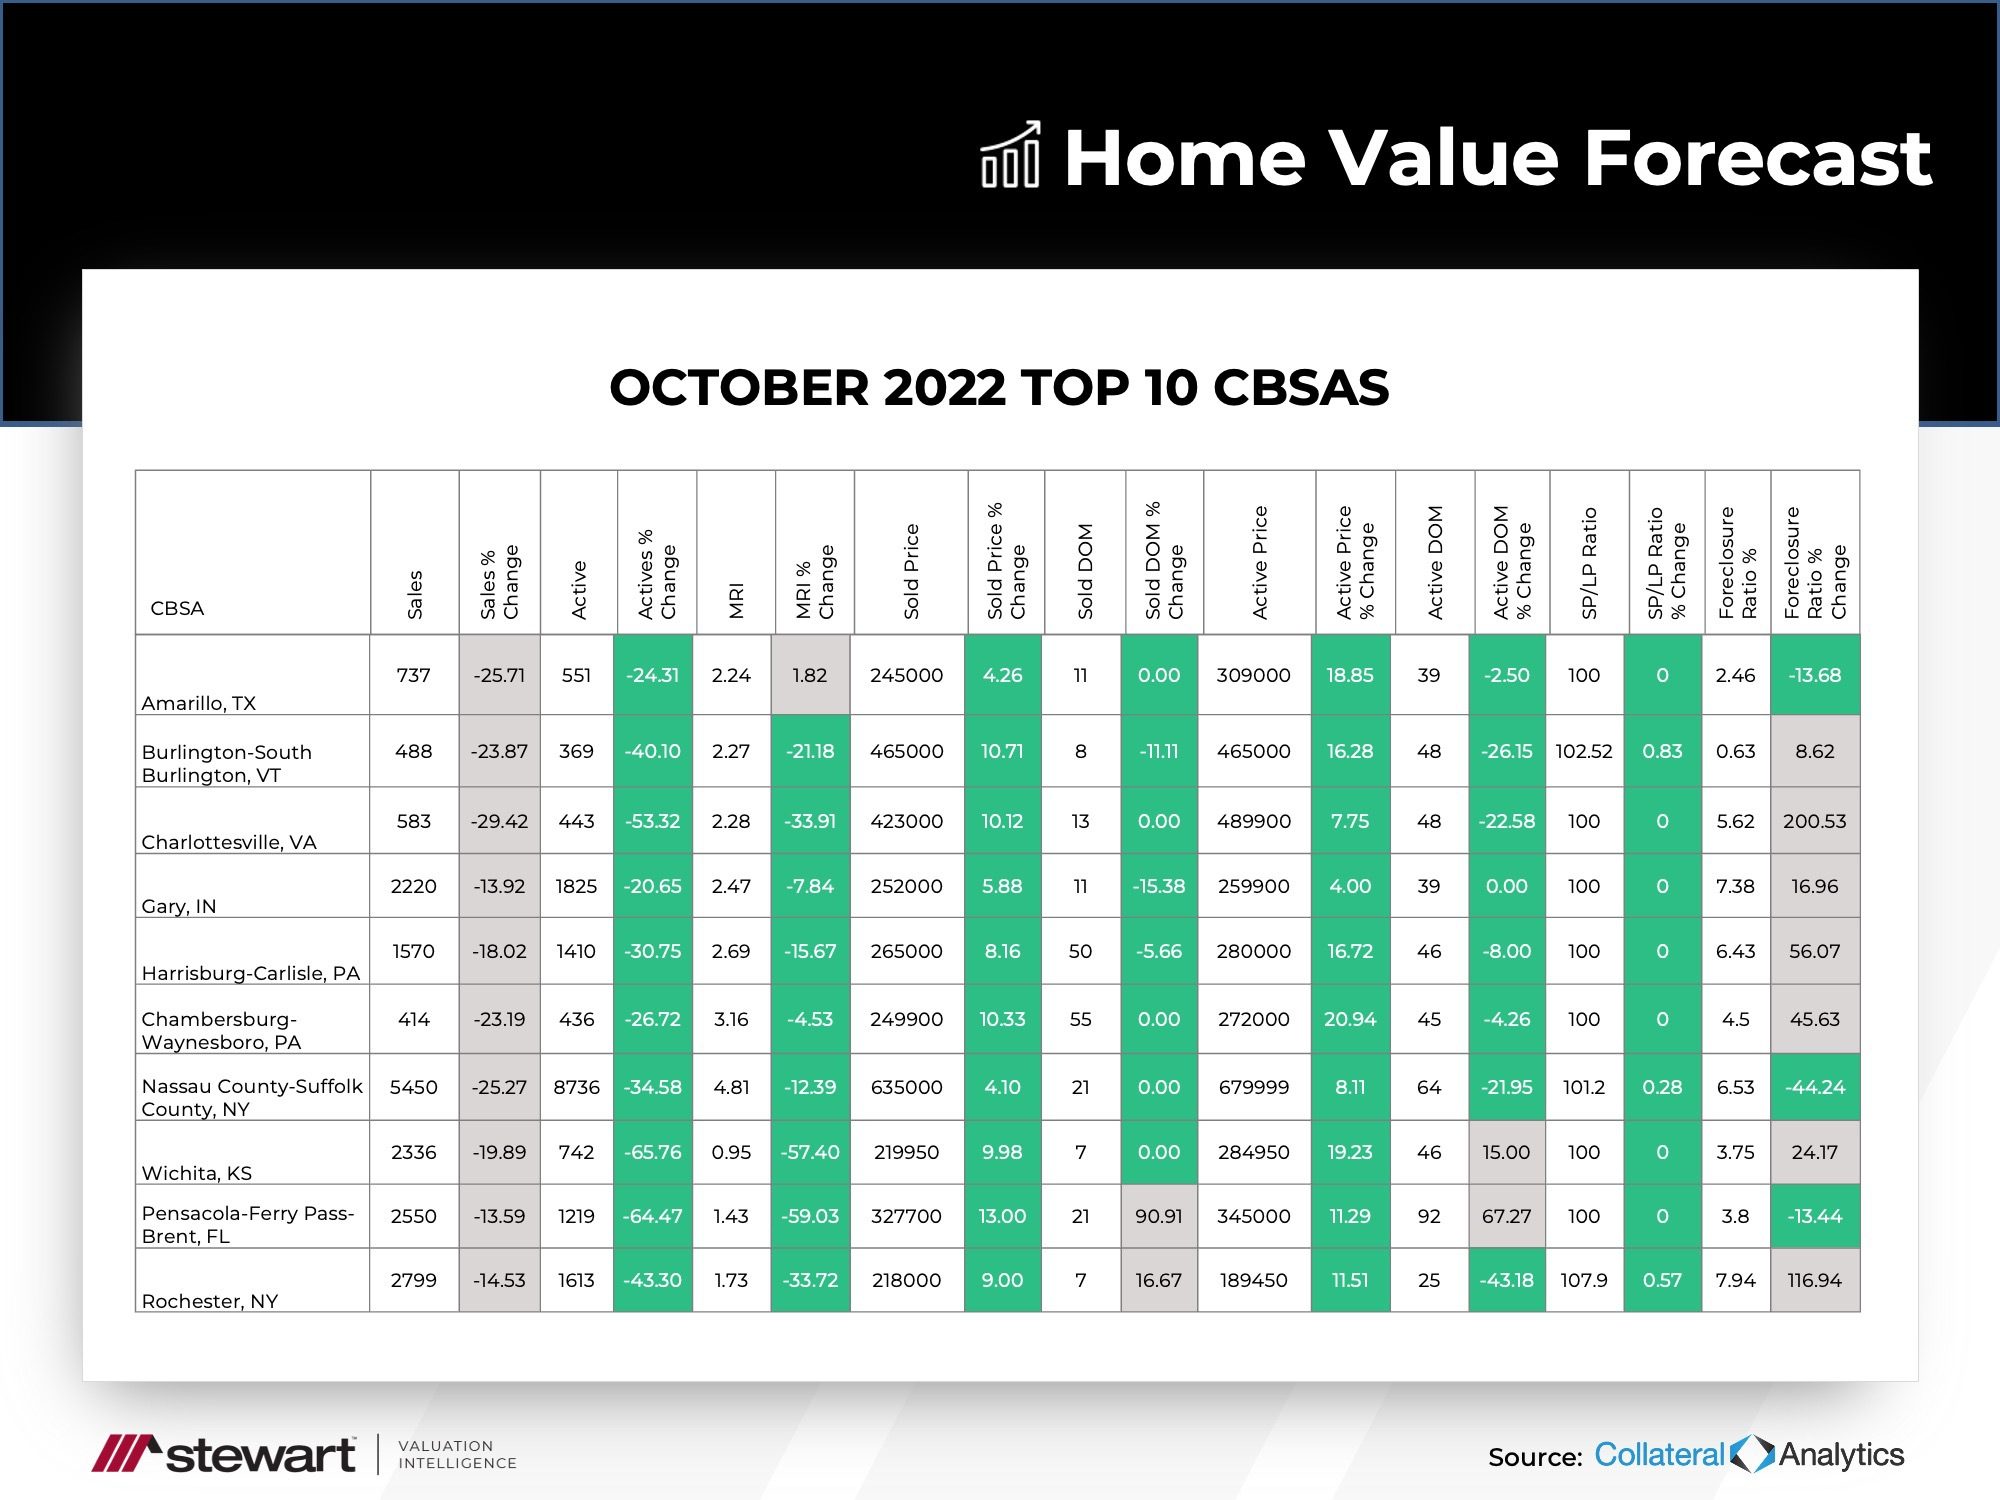
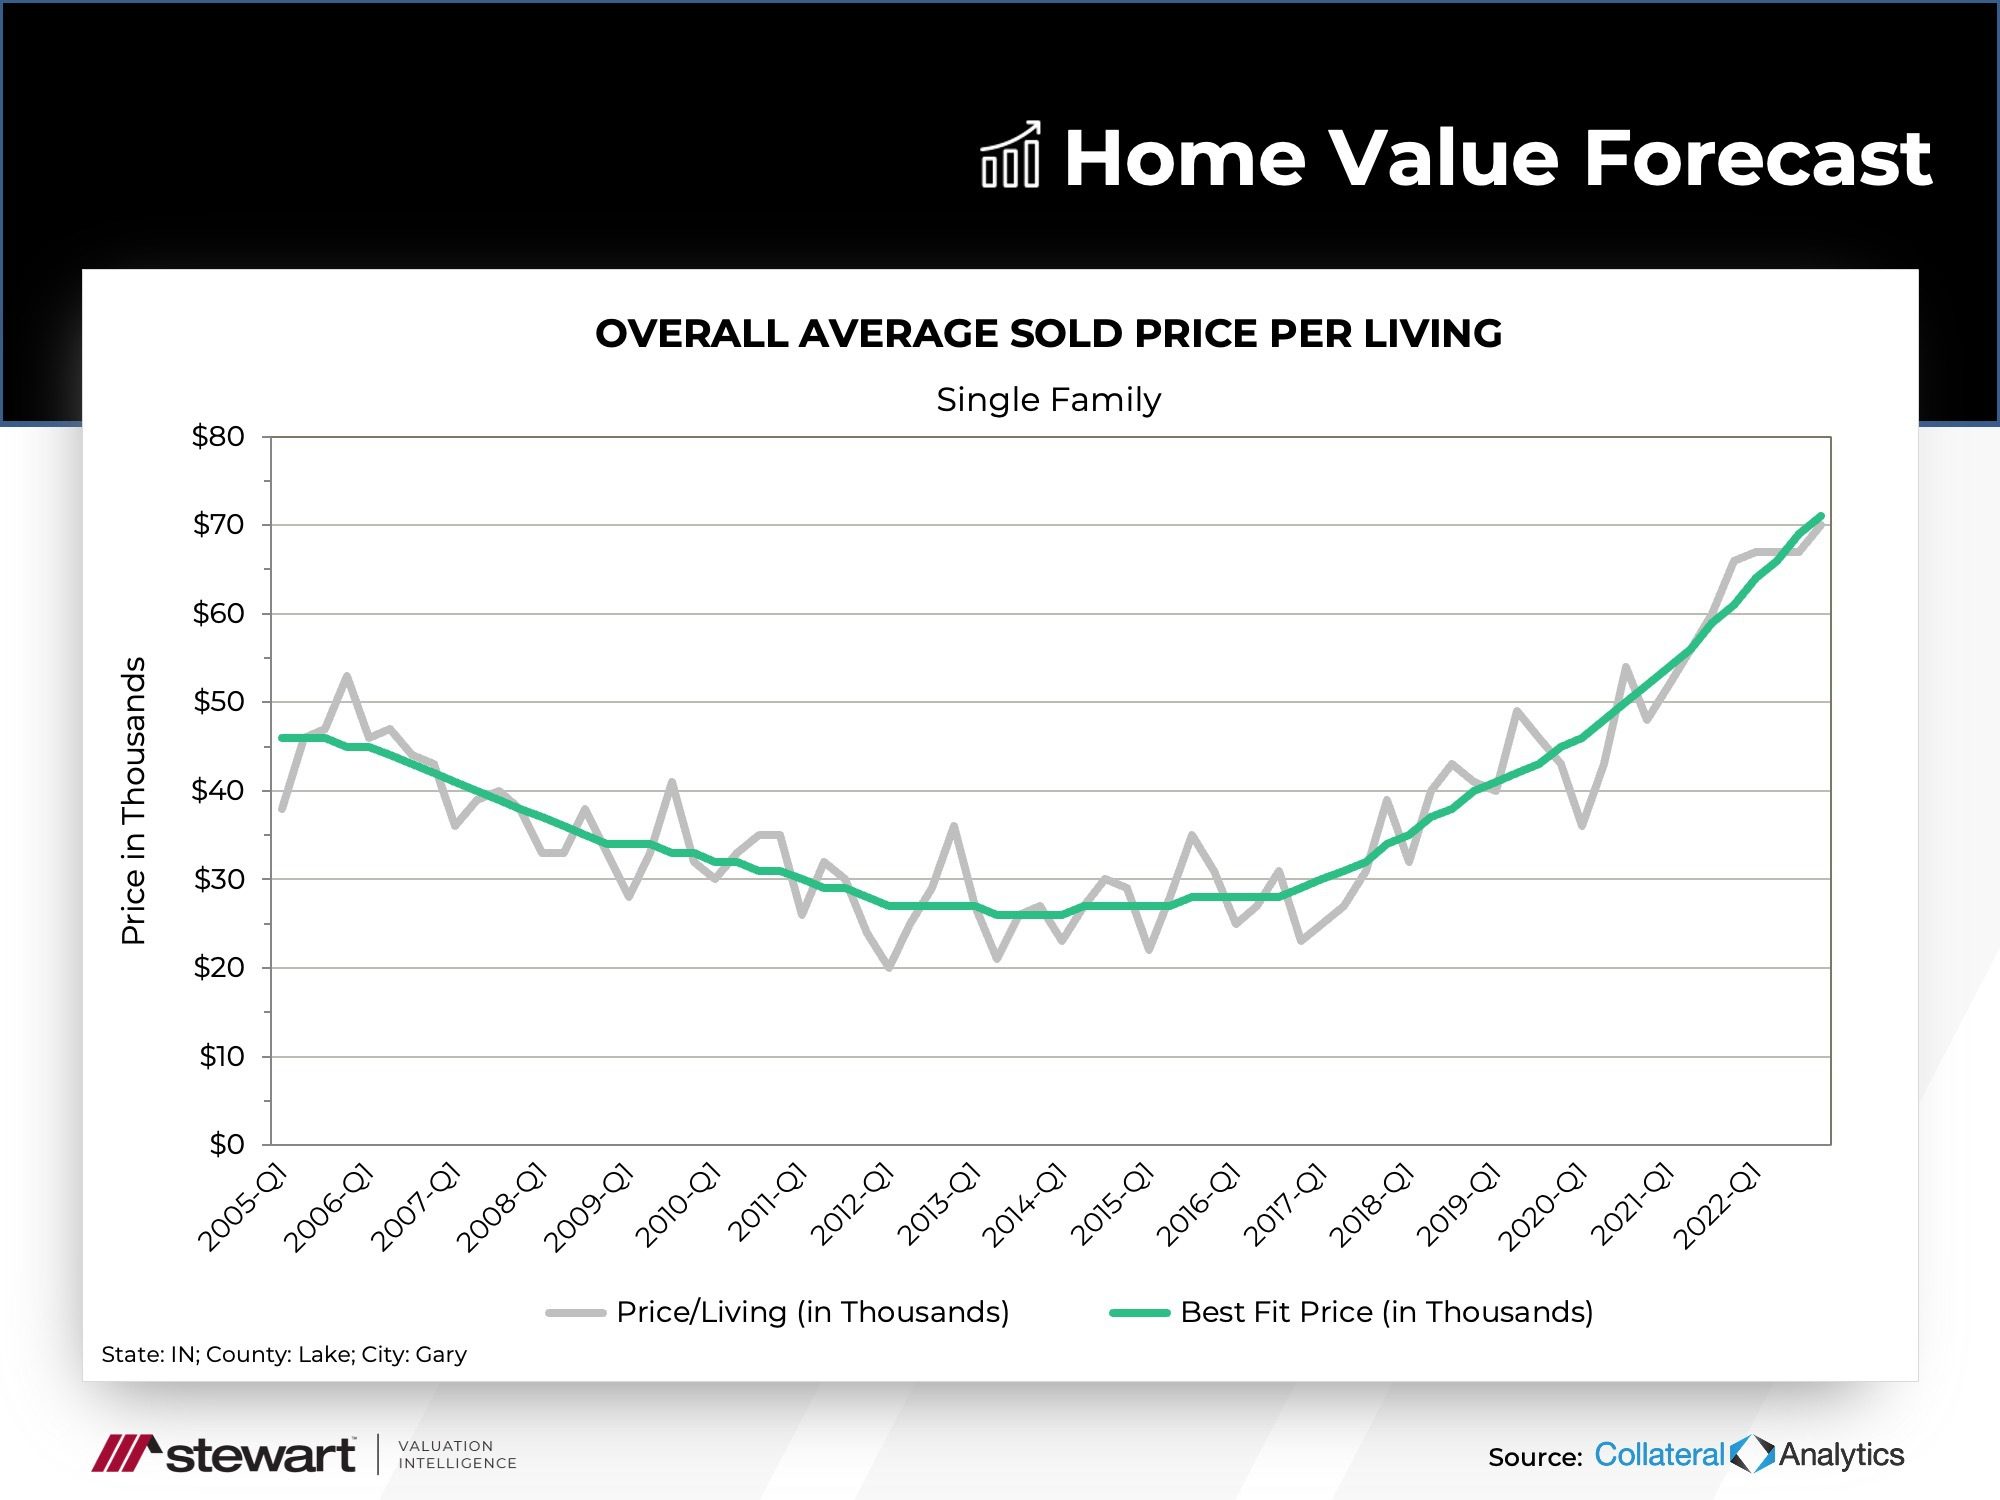
Gary, Indiana
We’ve written about Gary, Indiana before at Home Value Forecast, but never in the Top 10. Since our rating system looks at market momentum at a point of time, many smaller markets that historically weren’t as overheated as larger metros are starting to show up on our list. This month, Gary is having its day in the spotlight.
While home prices in Gary are well below national averages, the price per square foot of living area has doubled in the last five years. It took until 2019 — 14 years for prices to match 2005 levels — but averages are up another 33% in just three years.
The Fed just raised interest rates for the sixth time this year, which should further cool down the markets and move everything more into balance.
ABOUT STEWART VALUATION INTELLIGENCE’S MONTHLY HOUSING MARKET REPORT
The Home Value Forecast uses a ranking system that is purely objective and is based on directional trends of market indicators. Each indicator is given a score based on whether the trend is positive, negative or neutral for that series. For example, a declining trend in active listings would be positive, as would an increasing trend in average price. A composite score for each CBSA is calculated by summing the directional scores of each of its indicators.