Home Value Forecast
HVF Monthly Housing Report: The Ripple Effect in Colorado
Each month, HVF’s Housing Market Report uses a number of leading real estate market-based indicators to report on activity in the single-family home markets in the top 200 metropolitan areas (CBSAs) in the U.S.
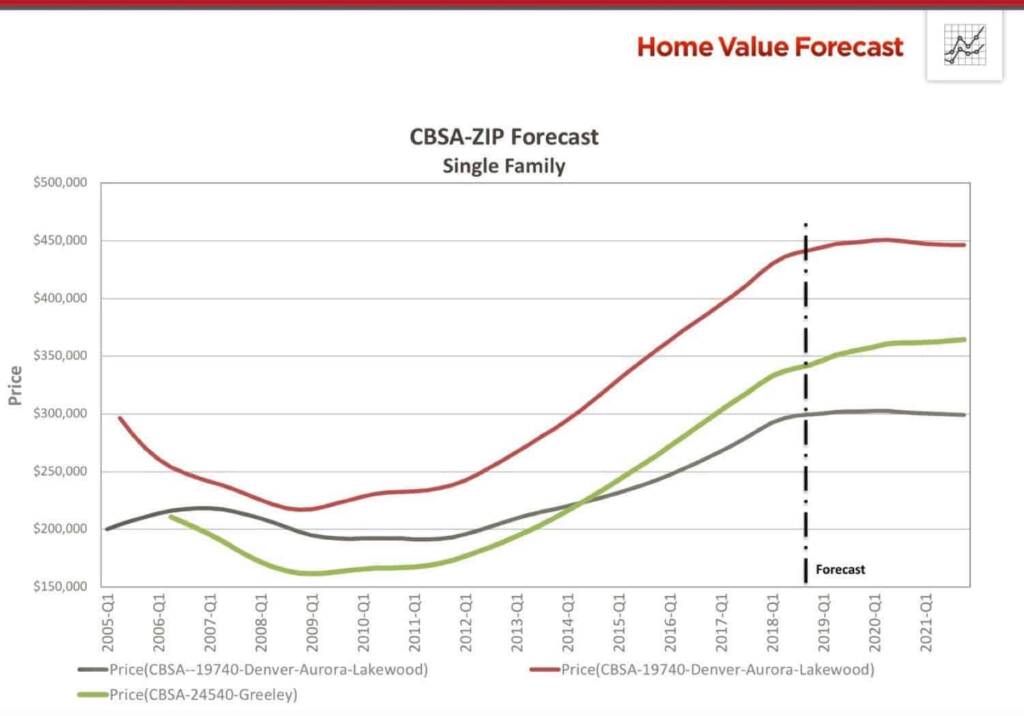
In this month’s Housing Market Report, the Centennial State has hit the trifecta on our Top 10 hottest housing markets, with Denver, Colorado Springs and Greeley all making the list. While Denver has been a series regular, Greeley and Colorado Springs are newer members of the exclusive club.
Denver, Greeley and Colorado Springs all have under 2.5 Month of Remaining Inventory, and all have experienced rapid price gains over the last five years.
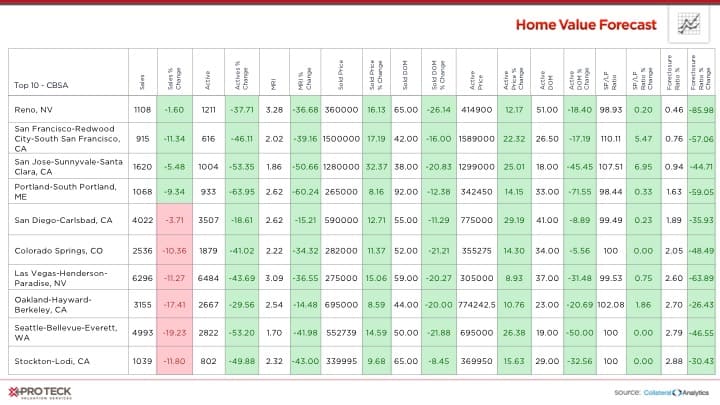
For this month’s Top 10, all of the CBSAs featured have Sold Days on Market of 50 or less. Seeing that the loan closing process used to average 50 days, you can see the speed in which homes are going under contract:
Top 10

With houses remaining on the market for such a short period of time, buyers are going to great lengths to seal the deal – one buyer in Denver included roundtrip airfare to Paris to help their bid stand out from the others.
When prospective homeowners in Colorado don’t have the assets for such an extreme offer, the Sold Price of homes in Colorado Springs and Greeley are $138,000 and $100,000 less than Denver, respectively. Greeley (65 miles north) and Colorado Springs (70 miles south) are both about an hour and a half drive to Denver on highways that can see the commute stretch to over two hours during rush hour. While extreme, towns in the south of the Greeley CBSA and in the north in the Colorado Springs CBSA are becoming the best compromise for Colorado homebuyers.
Interested in learning more about the top metros featured in this month’s market report? Contact SVI for more in-depth information on each CBSA listed in this month’s report.
About SVI’s Monthly Housing Market Report
The Home Value Forecast uses a ranking system that is purely objective and is based on directional trends of nine market indicators. Each indicator is given a score based on whether the trend is positive, negative or neutral for that series. For example, a declining trend in active listings would be positive, as would an increasing trend in average price. A composite score for each CBSA is calculated by summing the directional scores of each of its indicators. From the universe of the top 200 CBSAs, each month we highlight topics and trends in the real estate market.